Best & Worst Years of Mercury Mountaineer – Graphs, Reviews, & Reliability Data

Travel back to the 1990s, and you’ll find an SUV market just starting to heat up. The Jeep Grand Cherokee and Ford Explorer had helped light the fire earlier in the decade, but Mercury dealers were left out in the cold as Ford retailers sold hundreds of thousands of Explorers each year. To overcome the […]
Best & Worst Years of Cadillac STS – Graphs, Reviews, & Reliability Data
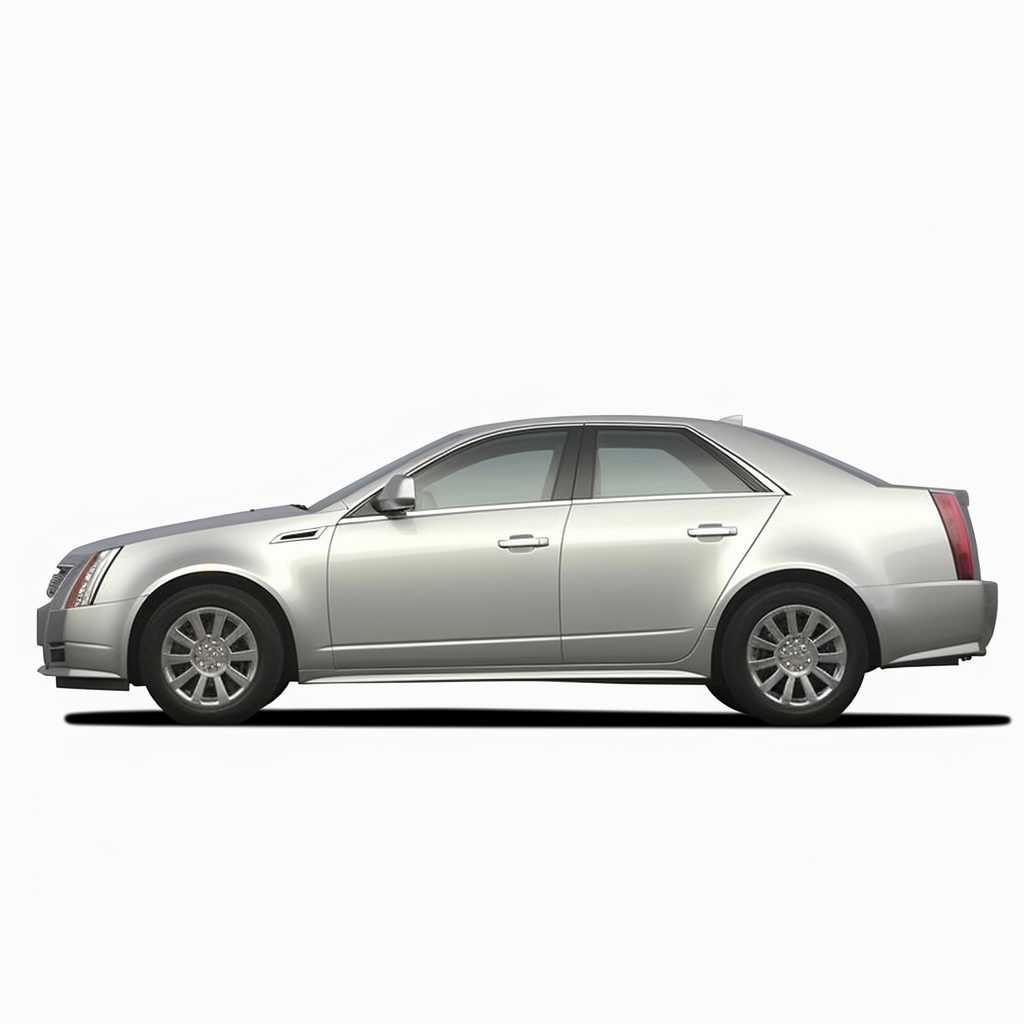
Cadillacs of the 20th century were known for length and opulence, earning the less-than-complimentary “luxobarge” moniker. But a new century gave General Motors’ luxury division an opportunity to take on the Mercedes-Benz E-Class and BMW 5 Series. In 2005, Cadillac launched the STS, a sleek and stylish sedan with European DNA and American muscle under […]
Best & Worst Years of Cadillac Escalade – Graphs & Owner Surveys
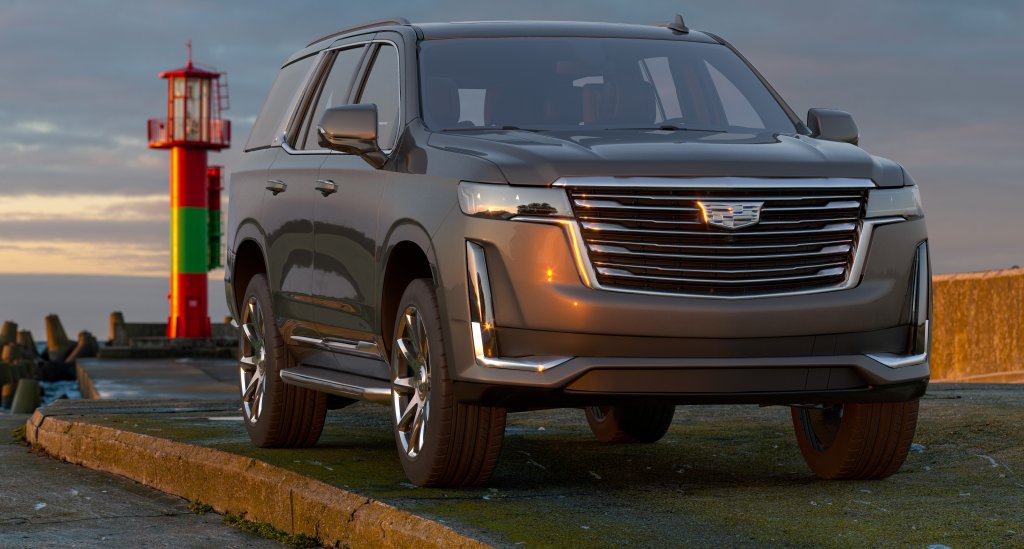
The Cadillac Escalade arrived over 20 years ago as a reskinned GMC Yukon. Since then, it has gone on to become one of the most coveted luxury full-size SUVs in the industry. Oozing with high-end amenities, the Escalade has helped Cadillac get back to its “Standard of the World” form. Over those 20 years, the […]
Best & Worst Years of BMW 325i – Graphs & Owner Surveys

BMW’s 3-Series is a legend amongst luxury compact cars with continuous production spanning nearly 50 years. The BMW 325i variant was built between 2001 and 2006 as part of both the E46 and E90 generations. Powered by BMW’s famously smooth straight-6 engine, the 325i was a perennial favorite of experts and owners. However, like any […]
Buick Enclave | Depreciation Rate & Curve Graphed
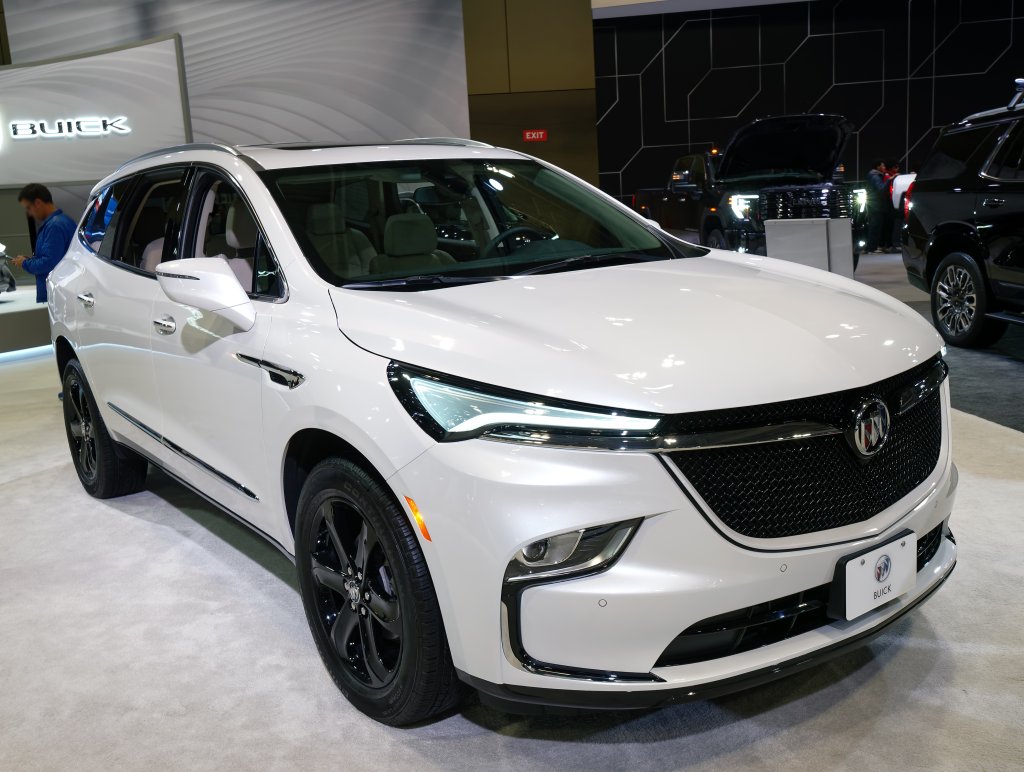
Find the depreciation rate of your Buick Enclave in the graph below. All vehicles depreciate over time, starting from the moment of purchase, and knowing a specific vehicle’s depreciation rate can help you understand its long-term value and total cost of ownership. Generally, the steepest depreciation takes place in the first year of ownership, after […]
Chevrolet Silverado 2500 HD | Depreciation Rate & Curve Graphed

Find the depreciation rate of your Chevrolet Silverado 2500 HD in the graph below. All vehicles depreciate, or lose value, from the moment of purchase. The Chevrolet Silverado 2500 HD is no exception. The most depreciation occurs during the first year; after the drop in value over those first 12 months, the Silverado 2500 HD […]
Jeep Wrangler | Depreciation Rate & Curve Graphed
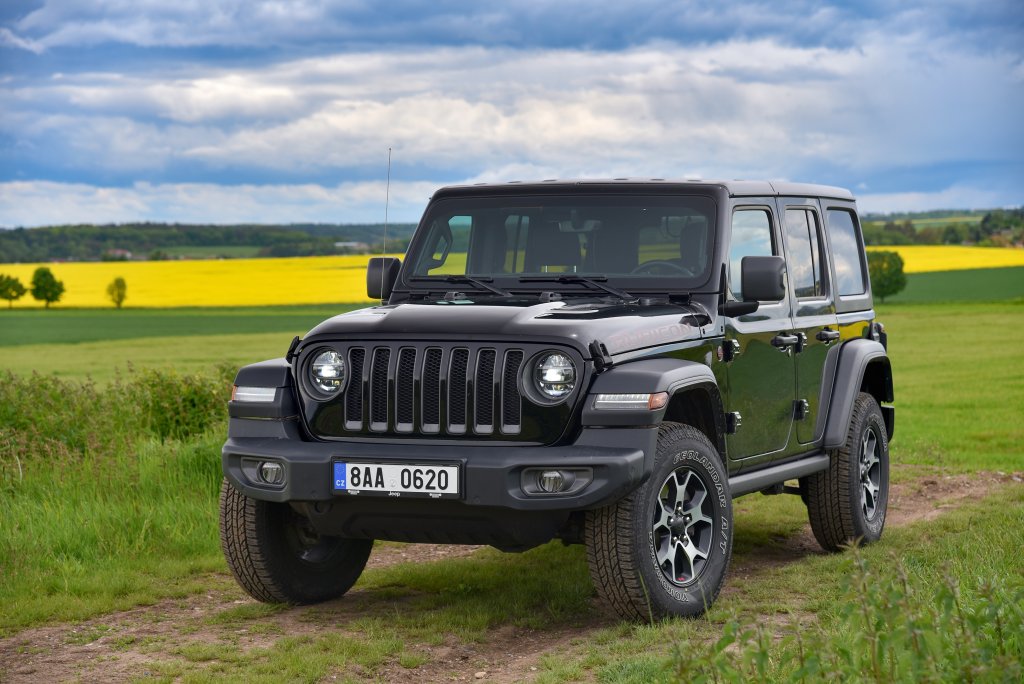
Find the depreciation rate of your Jeep Wrangler in the graph below. Every vehicle starts to depreciate, or lose value, the moment you purchase it. The Jeep Wrangler is no different. The greatest depreciation occurs in the first 12 months. After this drop in value over the first year, the Wrangler depreciates at a slower […]
Nissan Sentra | Depreciation Rate & Curve Graphed
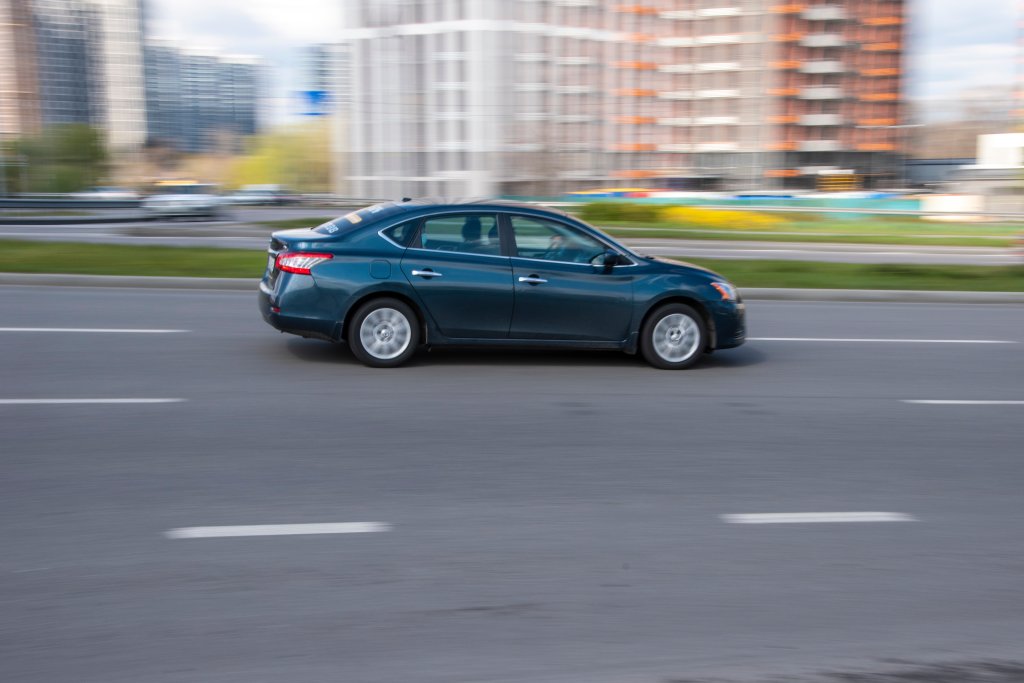
Find the depreciation rate of your Nissan Sentra in the graph below. Depreciation is the process of losing value over time, which affects all vehicles. By understanding how depreciation works, and the expected depreciation rate for a specific make and model, you can more accurately estimate your vehicle’s long-term value and total cost of ownership. […]
Toyota 4Runner | Depreciation Rate & Curve Graphed
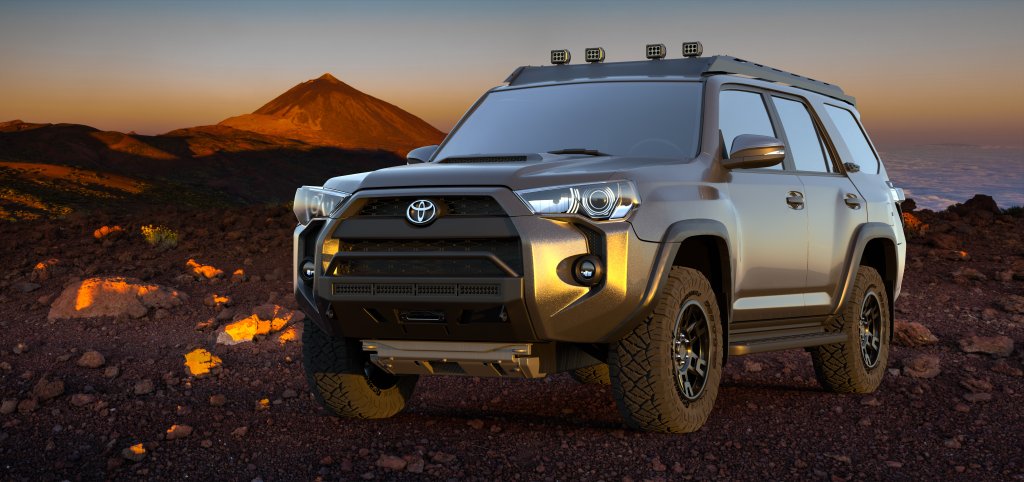
Find the depreciation rate of your Toyota 4Runner in the graph below. All vehicles, regardless of their initial value, begin to depreciate from the moment of purchase. The Toyota 4Runner is no exception to this rule. The most depreciation occurs during the first year after the initial purchase. After the initial drop, the 4Runner will […]
Chevrolet Impala | Depreciation Rate & Curve Graphed
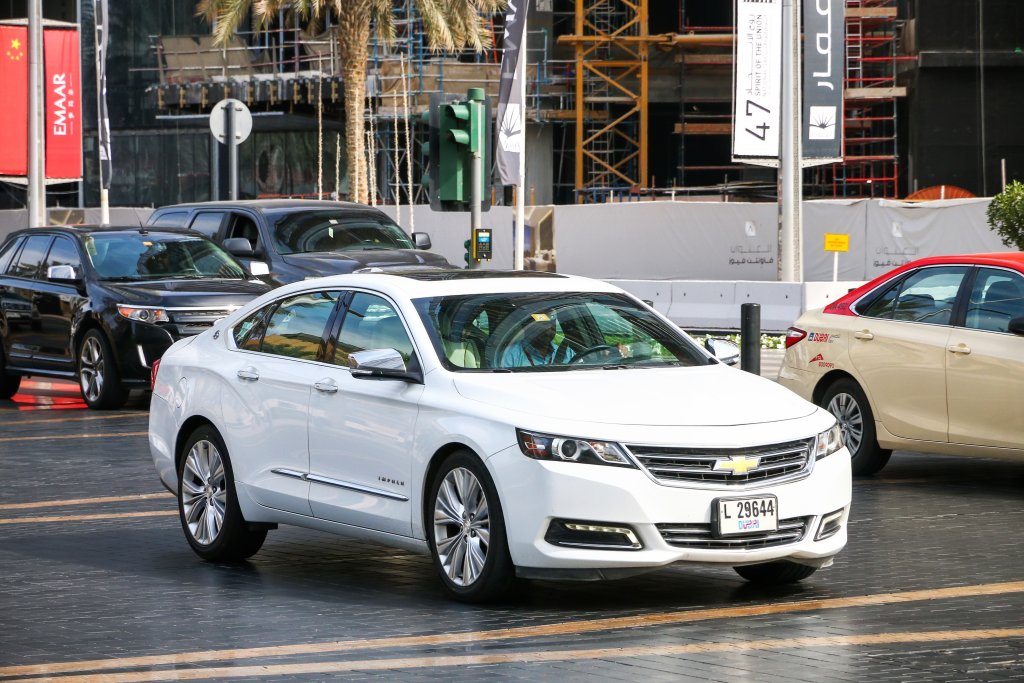
Find the depreciation rate of your Chevrolet Impala in the graph below. Depreciation is the process of losing value, which happens to all vehicles as soon as they’re purchased and driven off the lot. Certain makes and models depreciate faster than others, and understanding the depreciation rate of a particular vehicle can help you gain […]