Find the depreciation rate of your Ford Explorer in the graph below.
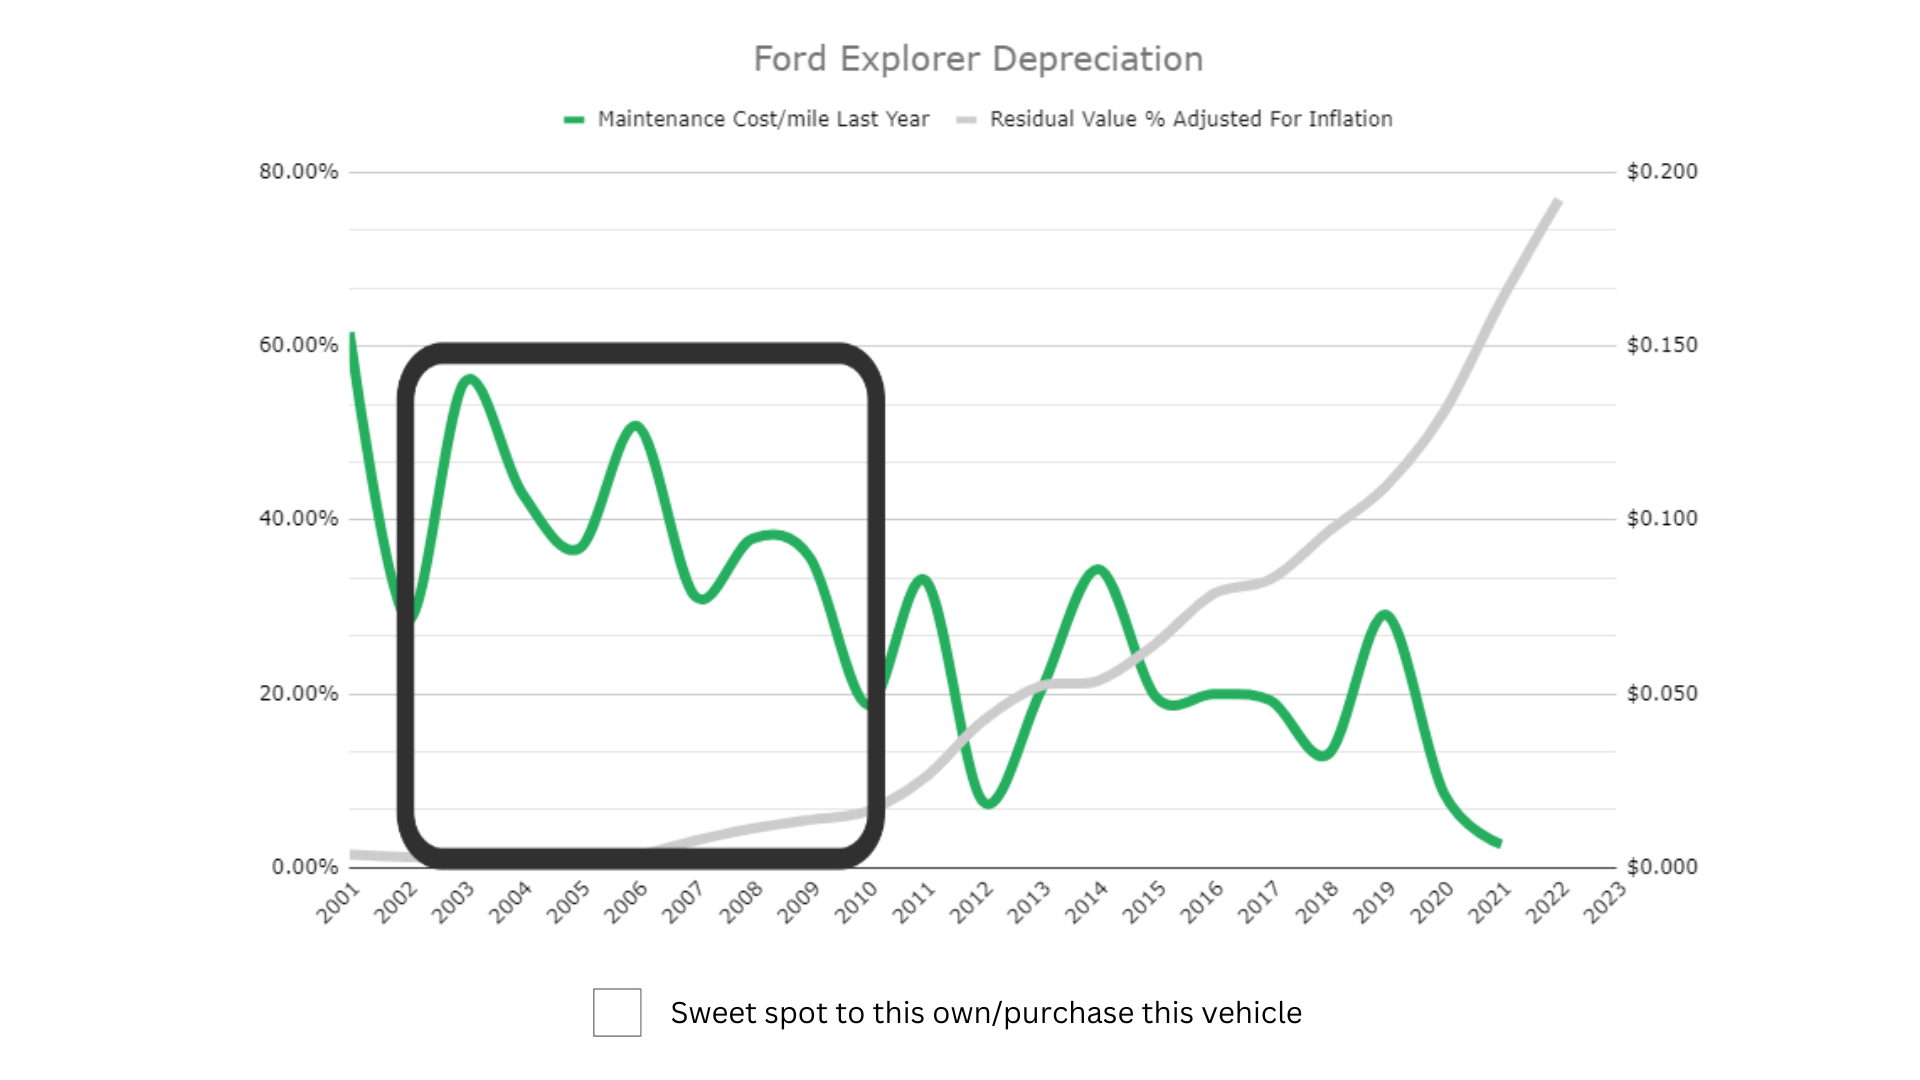
As with most products, the value of a vehicle depreciates over time. In fact, vehicle depreciation begins as soon as you drive your new vehicle off the lot and happens rapidly within the first 12 months of ownership. Over the first five years of owning a car, you can expect it to depreciate by around 60% of its original value.
Since the Explorer comes in a variety of trims and model years, you should research the potential depreciation rate of your specific vehicle. Its color, condition, and mileage may impact how much you get when reselling or trading it in.
Keep in mind that just because the vehicle costs the least to own in the sweet spot we have outlined here, you still may not want to own the vehicle during these depreciation sweet spot years. Although vehicles depreciate less as they get older, they have more repairs. Duh right? However, keep in mind that repairs don’t just cost you money, they cost you time. Reliability is the difference between being able to make it to your destination on time or missing an opportunity because the car broke down.
Check out our article on the best and worst years of the Ford Explorer to see our reliability ratings for all years of the Explorer between 2001-2022. We also cover MPG, safety ratings, and a number of other factors. We pulled data from Explorers registered in our app and surveyed owners to get you data-backed answers on just how good or bad each year of the Explorer is.
If you want to know the depreciation and maintenance costs for your particular vehicle, use our free “Total Cost of Ownership” tool available in the FIXD App – Android or IOS.
If you like our online tools and articles consider purchasing our FIXD sensor for $19.99 (this is 67% OFF). It’s our flagship product. With it, you scan your car for common engine problems.
If our sensor detects any problems with the engine, our app will clearly explain:
- What could have caused it and
- How much the possible repairs may cost.
If you’d like, we’ll even show you trusted repair shops in your area where you can get your ride fixed through RepairPal. The total cost of ownership feature within the app totals your maintenance costs, repairs, and depreciation (Sensor + App). This is free on the app.
Ford Explorer Depreciation
| Model Years | Mileage | Amount Depreciated | Residual Value Percentage | Resale Value |
| 2001 | 264,000 | $27,038.31 | 1.5% | $418 |
| 2002 | 252,000 | $30,175.74 | 1.2% | $378 |
| 2003 | 240,000 | $33,166.39 | 1.1% | $383 |
| 2004 | 228,000 | $33,687.46 | 1.4% | $465 |
| 2005 | 216,000 | $34,415.09 | 0.7% | $250 |
| 2006 | 204,000 | $34,690.11 | 1.4% | $484 |
| 2007 | 192,000 | $32,055.59 | 3.1% | $1,011 |
| 2008 | 180,000 | $32,641.18 | 4.5% | $1,537 |
| 2009 | 168,000 | $35,323.83 | 5.5% | $2,059 |
| 2010 | 156,000 | $35,336.80 | 6.5% | $2,446 |
| 2011 | 144,000 | $31,879.41 | 10.4% | $3,716 |
| 2012 | 132,000 | $29,005.00 | 16.9% | $5,912 |
| 2013 | 120,000 | $28,127.13 | 20.9% | $7,420 |
| 2014 | 108,000 | $28,672.65 | 21.5% | $7,869 |
| 2015 | 96,000 | $27,576.10 | 25.8% | $9,581 |
| 2016 | 84,000 | $25,710.97 | 31.5% | $11,813 |
| 2017 | 72,000 | $25,640.23 | 33.2% | $12,716 |
| 2018 | 60,000 | $23,983.56 | 38.7% | $15,142 |
| 2019 | 48,000 | $22,028.60 | 43.9% | $17,224 |
| 2020 | 36,000 | $18,814.43 | 52.4% | $20,717 |
| 2021 | 24,000 | $13,037.69 | 65.3% | $24,490 |
| 2022 | 12,000 | $8,462.25 | 76.9% | $28,201 |
| 2023 | 0 | N/A | N/A | N/A |
| 2024 | 0 | N/A | N/A | N/A |
The chart above conveys the approximate depreciation for a Ford Explorer. It is based on Kelley Blue Book data since 2001, assuming a vehicle in standard trim, a generic color such as black or white, and a mileage of 12,000 per year.
Keep in mind that the auto market was heavily affected in 2020 and beyond. Automakers selling new cars during the COVID pandemic raised prices which caused a spike in demand in the used car market as people tried to save money. Many automakers, however, did not drop prices after the pandemic, they kept them so they could make a larger profit.
This is why the most recent years of many vehicles have seemingly experienced less depreciation. Some, such as the 2007, 2011-2013, and the 2015-2022 models, may have even appreciated due to the heightened levels of inflation created.
Factors That Impact the Ford Explorer Depreciation Rate

If you’re looking for a vehicle that can hold its value, the Ford Explorer is a great option. Ford vehicles typically hold their value incredibly well; the manufacturer offers a wide array of trucks and SUVs, which reduces scarcity in the market and helps to stave off depreciation. Here are a few factors that can affect a Ford Explorer’s depreciation rate:
Age
One of the defining factors of a vehicle’s depreciation rate is its age, determined by the model year. A vehicle’s model year is the year it was released, though most vehicles are announced and become available for purchase during the year before their model year. Since a car begins depreciating as soon as you drive it off the lot at the dealership, you should review the age of the vehicle you want to buy to determine how much it’s depreciated already and how steeply the value may continue to drop.
Body Type
Body type refers to the kind of vehicle, and there are many to choose from, including SUVs, convertibles, sedans, trucks, and hatchbacks. Body type can contribute to depreciation because some types maintain value more effectively, especially when they’re well taken care of. For example, an SUV such as the Ford Explorer may hold its value better than a small sedan, as the Explorer has hardware and exterior features that protect its efficiency over time.
The body type of a vehicle can also affect how well it performs in various types of weather, which can make geographical location another detail to consider. A truck or SUV that’s kept in a snowy, cold climate, for example, will likely hold its value better than a convertible or sports car in the same location.
Mileage
Another key factor in determining a vehicle’s depreciation rate is its mileage. This refers to the number of miles that the car’s been driven, as displayed on the odometer. Mileage affects depreciation and resale value because the more miles a car has, the more likely it may have mechanical failures that require expensive repairs. For example, a Ford Explorer with 12,000 miles will have a lower depreciation rate than a Ford Explorer with 15,000 miles from the same model year.
Condition
The overall condition of a vehicle can impact its depreciation rate as well. When evaluating a vehicle’s condition, consider any type of flaw in the exterior, including minor damage such as scratches or dents and large-scale damage such as broken headlights or cracked windows. Many exterior issues can also cause mechanical failures in a car, affecting its function and efficiency. All these factors can lead to a higher depreciation rate and lower resale value.
It’s also important to consider the condition of a vehicle’s interior. For example, odors, debris, or tears in upholstery on the inside of a vehicle can all reduce its resale value. To ensure you get the most for your sale or trade-in, consider getting your car detailed before a price estimation so the interior is in the best possible condition.
Color
Color can also help determine a vehicle’s depreciation rate. Most vehicles come with a variety of options, but a study shows that yellow cars seem to hold their value the best. With yellow vehicles depreciating at around 13.5% over three years, this is lower than the overall average rate. Other colors that can depreciate more slowly than the overall average include beige, red, green, and orange.
Some colors that depreciate more quickly are black, brown, and gold cars, along with shades that are more subtle and common. This is because they often are in plentiful supply, being so popular, meaning demand isn’t as high as with yellow or other colored vehicles.
Other Costs of Ford Explorer Ownership
A vehicle’s depreciation rate is just one aspect of the total cost of ownership. Here are some other costs you may incur when purchasing a Ford Explorer:
Insurance
Insurance is one of the most important costs to consider when buying a vehicle, as it protects you and your vehicle in an emergency. The average cost to insure a Ford Explorer is $1,795 per year, which is lower than the national average of $2,014 per year for all vehicles in the U.S., according to Bankrate. This means that in the first five years of owning an Explorer, you can pay around $8,975 in insurance costs alone. The exact price you pay for auto insurance can depend on many factors, such as your driving record and insurance provider. There are also some states where it’s cheaper to insure an Explorer, as well as other specific makes and models.
Maintenance
Routine maintenance is another cost that you should consider before buying an Explorer. Vehicles need routine maintenance to ensure they remain functional and in great condition. When you’re getting ready to purchase a vehicle, consider the potential cost of maintenance to verify that it fits your budget. For example, the average annual repair cost for a Ford Explorer is around $793, higher than the $694 average cost for all vehicles. You can also budget for additional funds in case of emergency repairs, such as from a collision or bad weather.
The Best Model Year To Buy a Ford Explorer
Based on factors including price and reliability (but not depreciation), our choice for the best Ford Explorer model years to buy are 2011-2014, 2015-2019, and 2020-2021, but check out our article on the best and worst years of the Explorer to get the whole story.
Buying a Ford Explorer New vs. Used
| 20-Year Projection | ||
| Years Since Purchased | Depreciated Value | With Inflation |
| 1 | $28,268 | $31,207 |
| 2 | $24,004 | $28,051 |
| 3 | $19,262 | $22,627 |
| 4 | $16,138 | $19,027 |
| 5 | $14,226 | $16,693 |
| 6 | $12,204 | $14,285 |
| 7 | $11,579 | $13,574 |
| 8 | $9,484 | $11,183 |
| 9 | $7,903 | $9,351 |
| 10 | $7,683 | $9,188 |
| 11 | $6,212 | $7,552 |
| 12 | $3,823 | $4,778 |
| 13 | $2,389 | $3,039 |
| 14 | $2,022 | $2,599 |
| 15 | $1,654 | $2,094 |
| 16 | $1,140 | $1,429 |
| 17 | $515 | $644 |
| 18 | $257 | $324 |
| 19 | $515 | $644 |
| 20 | $404 | $498 |
There can be a large difference in savings when choosing to buy a used Ford Explorer vs. a new one. This is because purchasing a new car involves paying the full price for a new model and then watching that vehicle depreciate rapidly in the first year of ownership. With a used vehicle, you can find the model year that offers all the features you want and know that your vehicle will depreciate much slower.
For example, the total amount of depreciation for a new Ford Explorer after three years is $19,262, while the total cost of depreciation for a used Explorer over three years is $18,814.43 for almost double the time. To find vehicles with the lowest possible depreciation rate, conduct research online about the best models and years for maintaining value. You can also use an online calculator tool to determine exactly how much you can afford to spend and then find vehicles that fit your budget, checking each of their depreciation rates before you finalize a purchase.
You can also compare the monthly payments for leasing similar types of vehicles. This can guide your purchasing decision, as a lease typically considers the depreciation rate. Therefore, when a vehicle has high monthly payments for lease options, it may indicate that it also has a rapid depreciation rate.
Methodology
This research applies to the base-model trim for the Ford Explorer with standard options for all features. As the trim levels on this vehicle have varying specifications, the depreciation data can be different for each one. If you opt for a higher-level trim of the Ford Explorer, it may have a better chance of holding its value for a longer period.
There are also other factors that can affect the resale value of your Explorer, such as whether you sell it through a private party or trade it in at a dealership. Another contributing element is the COVID-era chip shortage that may impact resale values.
Keep in mind, there are large economic factors at play here too, and the sale of new cars has caused shifts in the used market too. There is a stark difference in the cost of vehicles due to car manufacturers seeking higher profit margins after COVID as detailed by CNN and posted by CBS channel 58:
“… (T)he auto industry saw sky-high profits even as sales plummeted. Domestic manufacturers of cars and car parts saw a profit of $32 billion through the third quarter of 2022 (the latest data available) — their largest profit since 2016. Car dealerships also reported record-breaking profits through Q3, according to auto-retail advisers Haig Partners.
That’s because pandemic-era pent-up consumer demand remained strong as supply shifted, allowing automakers to increase their prices and their profit margins. Cars and trucks were sold nearly as soon as they hit dealership lots, and the average price paid for a vehicle in December soared to a near-record high of $46,382, according to J.D. Power.
Data from the Labor Department’s November Consumer Price Index shows American consumers are paying about 20% more for cars than they were in 2019.
The trend could continue into next year — research website Edmunds expects new-car sales to hit 14.8 million in 2023, a marginal increase from last year but well below pre-pandemic levels.
The auto industry has entered a new era: Less choice, higher prices and larger profit margins. So far it seems to be working for them.”
This shift by car companies to create higher profit margins by taking advantage of the heavily-reported-on chip shortage panic of COVID has had rebounding effects upon the value of used cars.
Be aware that newer years (the latest 3-4 model years) may be inflated in price because of this and depending on how big this problem is for the model you are considering – it may even be inflating the price of the older model years.
Frequently Asked Questions About Vehicle Depreciation
Here are some answers to frequently asked questions about vehicle depreciation:
Do Ford Explorers hold their value?
Ford is known for vehicles that stand the test of time, and the Explorer is no different. While Explorers typically hold their value well and offer great potential for resale, the exact value they maintain can vary, depending on many circumstances. The color, trim level, and condition of your vehicle can determine how much you’re able to resell it for.
The method you use to sell your vehicle can also affect its resale value. For example, a 2021 black Ford Explorer with standard equipment has a resale value for dealer trade-in ranging from $23,976 to $25,612, according to Kelley Blue Book. However, that range increases to $27,501 to $29,412 for a private sale.
What are the best years of Ford Explorer to buy and which ones should you avoid?
The best years of the Ford Explorer to buy are the 2011-2014, 2015-2019, and 2020-2021 models. These model years have shown excellent reliability over time, as well as strong fuel economy and safety features. In terms of the worst years for the Explorer, you should stay away from the 2001, 2002-2005, and 2006-2010 models. Reviewers have rated Explorers from those years poorly in a variety of areas, including low reliability, poor safety, decreased fuel economy, and a high likelihood of needing expensive repairs.
What's high mileage for a Ford Explorer?
While high mileage for a Ford Explorer is typically considered to be 200,000 miles, many of these vehicles continue to perform efficiently well beyond this mileage. You can preserve the functionality and capabilities of your vehicle by taking it for routine maintenance and driving primarily on the highway instead of in dense urban areas or off-road.
How old of a Ford Explorer should you buy to avoid most of the depreciation?
To avoid rapid depreciation after you purchase a Ford Explorer, look for available used models from 2002-2010. These models typically have the best potential for maintaining their value after resale, meaning you can slow depreciation by opting for a model from these years and taking great care of it. To stay in the sweet spot of low depreciation and maintenance costs, opt for an Explorer from 2007-2010.
References
(2023.) Best & Worst Years of Ford Explorer — Graphs & Owner Surveys. FIXD. Retrieved August 4, 2023, from https://www.fixdapp.com/car-reviews/best-worst-years-of-ford-explorer-graphs-owner-surveys/
(2023.) Do Ford Vehicles Hold Their Value? Germain Ford of Beaver Creek. Retrieved August 4, 2023, from https://www.germainfordofbeavercreek.com/do-ford-cars-hold-their-value.html#:~:text=Even%20with%20so%20many%20out,over%20a%205%2Dyear%20period.
(2023.) Ford Explorer Costs. CarEdge. Retrieved August 4, 2023, from https://caredge.com/ford/explorer#insurance
(2022.) Yellow Car Color Has The Least Depreciation, Study Says. Retrieved August 14, 2023, from https://gmauthority.com/blog/2022/06/yellow-car-color-has-the-least-depreciation-study-says/
(2022.) How to Beat Car Depreciation. Kelley Blue Book. Retrieved August 4, 2023, from https://www.kbb.com/car-advice/how-to-beat-car-depreciation/
(2022.) What Used Cars are the Cheapest to Insure in Illinois. FIXD. Retrieved August 4, 2023 from https://www.fixdapp.com/auto-insurance/what-used-cars-are-the-cheapest-to-insure-in-illinois/
(2021.) 12 Factors That Affect Your Car’s Resale Value. Money Crashers. Retrieved August 4, 2023 from https://www.moneycrashers.com/factors-affect-used-cars-resale-value/

At FIXD, our mission is to make car ownership as simple, easy, and affordable as possible. Our research team utilizes the latest automotive data and insights to create tools and resources that help drivers get peace of mind and save money over the life of their car.


