Search
Close this search box.
Search
Close this search box.

Ford Mustang | Depreciation Rate & Curve Graphed

On average, the Ford Mustang loses 42.3% of its value in the first five years. Based on the depreciation curve and maintenance cost per mile, we place the ownership sweet spot for the Ford Mustang as the 2003-2011 model years. To get at least five years in the sweet spot, do not buy anything older than a 2008.

American muscle car Ford Mustang in a red color on the forest road..
TABLE OF CONTENTS

Find the depreciation rate of your Ford Mustang in the graph below.

Ford Mustang Depreciation

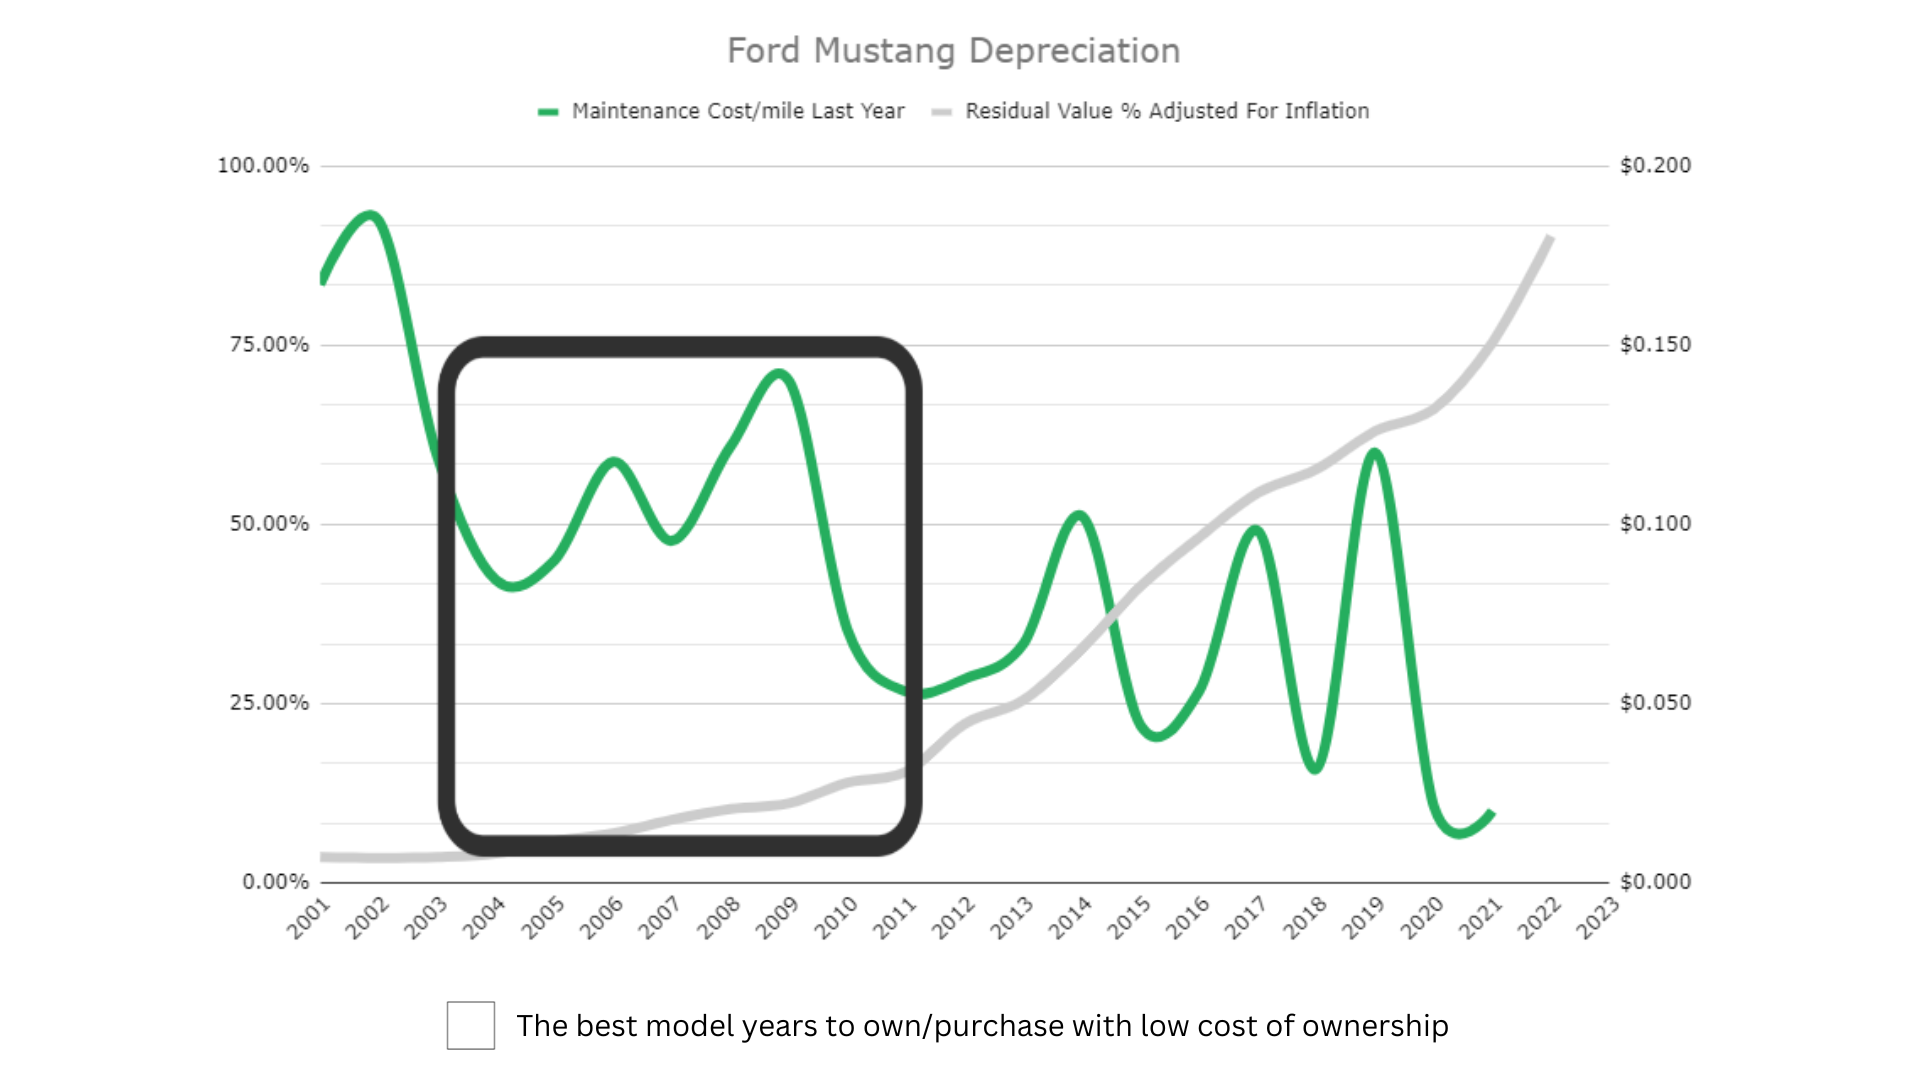
All vehicles depreciate, though not all at the same rate. By knowing the depreciation rate of a specific vehicle, you can better understand the total cost of owning it and the long-term value it may provide. The steepest drop in value normally occurs in the first 12 months of ownership and slows gradually until the five-year mark. With the Mustang, however, years one and two each see a more considerable annual depreciation than the initial year of ownership.

Keep in mind that just because the vehicle costs the least to own in the sweet spot we have outlined here, you still may not want to own the vehicle during these depreciation sweet spot years. Although vehicles depreciate less as they get older, they have more repairs. Duh right? However, keep in mind that repairs don’t just cost you money, they cost you time. Reliability is the difference between being able to make it to your destination on time or missing an opportunity because the car broke down.

Check out our article on the best and worst years of the Ford Mustang to see our reliability ratings for all years of the Mustang between 2001-2021. We also cover MPG, safety ratings, and a number of other factors. We pulled data from Mustangs registered in our app and surveyed owners to get you data-backed answers on just how good or bad each year of the Mustang is.

If you want to know the depreciation and maintenance costs for your particular vehicle, use our free “Total Cost of Ownership” tool available in the FIXD App – Android or IOS.

If you like our online tools and articles consider purchasing our FIXD sensor for $19.99 (this is 67% OFF). It’s our flagship product. With it, you scan your car for common engine problems.

If our sensor detects any problems with the engine, our app will clearly explain:

  1. What could have caused it and
  2. How much the possible repairs may cost.


If you’d like, we’ll even show you trusted repair shops in your area where you can get your ride fixed through RepairPal. The total cost of ownership feature within the app totals your maintenance costs, repairs, and depreciation (Sensor + App). This is free on the app.

Ford Mustang Depreciation

Model YearsMileageAmount DepreciatedResidual Value PercentageResale Value
2001264,000 $ 20,292.033.6%$767
2002252,000 $ 21,239.183.5%$773
2003240,000 $ 21,757.113.6%$818
2004228,000 $ 22,077.844.1%$946
2005216,000 $ 22,839.175.8%$1,418
2006204,000 $ 23,033.616.9%$1,708
2007192,000 $ 22,941.368.8%$2,218
2008180,000 $ 22,902.7210.3%$2,643
2009168,000 $ 23,834.8311.1%$2,991
2010156,000 $ 23,293.8614.0%$3,798
2011144,000 $ 23,490.7915.5%$4,304
2012132,000 $ 21,439.9122.2%$6,106
2013120,000 $ 20,210.4325.5%$6,908
2014108,000 $ 18,456.7232.7%$8,948
201596,000 $ 16,734.7641.4%$11,829
201684,000 $ 14,886.3348.2%$13,876
201772,000 $ 13,627.5254.4%$16,230
201860,000 $ 13,188.8457.7%$17,957
201948,000 $ 11,718.6063.0%$19,960
202036,000 $ 11,352.8666.1%$22,146
202124,000 $ 7,954.1375.4%$24,359
202212,000 $ 2,865.3490.2%$26,457
20230 N/AN/AN/A

The data in the chart above conveys the approximate depreciation for a Ford Mustang. It’s based on Kelley Blue Book data since 2001, assuming a Mustang in standard trim, a generic color such as black or white, and a mileage of 12,000 per year.

Keep in mind that the auto market was heavily affected in 2020 and beyond. Automakers selling new cars during the COVID pandemic raised prices which caused a spike in demand in the used car market as people tried to save money. Many automakers, however, did not drop prices after the pandemic, they kept them so they could make a larger profit.

This is why the most recent years of many vehicles have seemingly experienced less depreciation. Some, such as the 2014, 2015, and 2021 models may have even appreciated due to the heightened levels of inflation created.

Factors That Impact the Ford Mustang Depreciation Rate

Car loan concept, Saving money for car concept, trade car for cash concept, finance concept.

Though Ford vehicles can deliver solid on-road performance, the automaker as a whole doesn’t have the best reputation, with Consumer Reports describing it as being “ranked near the bottom third for reliability.” Part of Ford’s poor reputation may be due to the relatively high number of recalls affecting its lineup, including the Mustang, which has seen more than a dozen recalls in the last five model years alone. With that being said, the Mustang is also an iconic brand, and its long-time status as a coveted muscle car seems to counter the impact of a poor reputation.

Reputation aside, several other factors contribute to the depreciation and long-term value of a vehicle. They include the following factors.

Age is determined by model year, which denotes a particular version of a vehicle more so than the calendar date of its release. Say, for example, you buy a 2022 Ford Mustang that has had no previous owners. Although it’s a brand-new vehicle, it’s still at least a year old because a new model year has hit the market since its initial release.

Outside of classic cars and rare vehicles, the current model year will always have the most value. That’s because successive releases tend to introduce new designs, features, and technologies that boost consumer appeal.

Body type refers to the general shape and size of a vehicle. Broadly speaking, we can classify most consumer vehicles under one of the following body types:

  • Sedan
  • Coupe
  • Hatchback
  • Station wagon
  • SUV
  • Minivan
  • Pickup truck

The Ford Mustang is primarily a coupe, which means it has a two-door configuration with a three-box design — that is, it can be described as having three distinctive segments: the engine, the cabin, and the trunk. In the North American market, small passenger cars such as coupes, being less popular than SUVs, are generally thought to retain less value than larger-body vehicles. However, given that the Mustang is also a muscle car, it meets the demands of a niche market. It may, therefore, retain value better than other vehicles within its broader class.

Mileage can refer to the number displayed on a vehicle’s odometer as well as the miles per year that the vehicle has averaged. The former describes the overall use the vehicle has seen in its lifetime, while the latter is a calculation of total mileage divided by the vehicle’s age. While both point to the amount of wear and tear you can expect the vehicle to have, the mileage per year may be a more accurate measure of long-term reliability.

To understand, consider that, on average, American drivers clock 12,000 miles per year, which is the figure on which we base our model. So, if you have a 5-year-old Mustang with just 40,000 miles on the odometer, it’s likely to have experienced less mechanical stress than the average vehicle in the United States. That suggests that the vehicle’s operating components are less worn out and more likely to last over the long run.

Overall condition refers to a vehicle’s appearance and operability. A Mustang with no cosmetic blemishes or mechanical issues would be in great overall condition, so it would likely hold greater value than a Mustang of the same model year with dents, torn upholstery, and transmission problems.

Drivers can take several measures to preserve or improve the overall condition of their vehicle. Repairs and routine maintenance, for example, can keep the vehicle looking and running the way it should, and safe driving practices can help avoid accidents that compromise looks and function.

A 2023 study by the used-car site iSeeCars examined the impact that a vehicle’s color may have on its resale value. The colors associated with the best resale value were yellow, beige, orange, and green. Vehicles in these colors had depreciation rates ranging from 13.5% to 19.2% over three years, which are considerably lower than the 22.5% average for all vehicles. Common colors such as white, blue, silver, gray, and black stayed closer to the overall average, while unpopular colors such as brown and gold had faster-than-average depreciation.

Other Costs of Ford Mustang Ownership

The cost of owning a vehicle goes beyond just its sticker price and depreciation. Several other factors to consider are as follows.

Insurance

Every auto insurer has its own system for calculating insurance rates, but they all consider some common variables, including the make and model of the vehicle. In general, affordable vehicles and ones with more safety features attract lower insurance rates because they cost less to replace and present less risk to the insurance company.

The Ford Mustang is fairly costly in terms of insurance rates. We’ve found that the average rate for a 30-year-old driver (generally considered a safe and experienced demographic) is $209 per month, or $2,508 per year. That’s much higher than the national average for all vehicles, which is $136 per month, or $1,630 per year. The higher-than-normal insurance rates are possibly due to the Mustang’s status as a sports car, a class of vehicles that represents a higher degree of risk because drivers may like to operate them at higher speeds.

Maintenance

Repairs and routine maintenance are essential for preserving value because they help keep a vehicle in optimal operating condition. Taking all of the model years together, we see that the average yearly maintenance cost for the Ford Mustang is around $697, which is approximately on par with the $694 average for all vehicles.

However, some model years have significantly higher average maintenance costs, which you may notice in our graph of the current market values of the Ford Mustang from 2001 to 2021. If you’re looking to keep your repair and maintenance costs to a minimum, then we would advise you to avoid the following model years:

  • 2001-2003
  • 2006
  • 2008
  • 2013
  • 2017
  • 2019

The Best Model Year To Buy a Ford Mustang

Based on factors including price and reliability (but not depreciation), our choice for the best Ford Mustang model years to buy are the 2004, 2007, 2018, and 2020, but check out our article on the best and worst years of the Mustang to get the whole story.

With all the model years mentioned above, owner reliability scores are no lower than eight out of ten, and the average cost of maintenance is either around the national average or well below it. The 2004 and 2007 model years also fall within the ownership sweet spot.

Buying a Ford Mustang New vs. Used

20-Year Projection Table
20-Year Projection
Years Since PurchasedDepreciated ValueWith Inflation
1$25,049$27,652
2$20,939$24,468
3$18,356$21,562
4$17,495$20,628
5$16,023$18,802
6$15,107$17,682
7$13,385$15,691
8$11,497$13,556
9$9,081$10,744
10$7,081$8,468
11$6,165$7,494
12$4,304$5,380
13$3,888$4,944
14$3,082$3,962
15$2,860$3,621
16$2,444$3,064
17$1,916$2,396
18$1,611$2,027
19$1,139$1,425
20$1,000$1,232

A brand-new 2023 Ford Mustang will run you at least $27,770. In three years, assuming an average annual mileage of 12,000, that vehicle may be expected to depreciate to $18,356, representing a total accumulated depreciation of $9,414. In comparison, a used 2021 Mustang has a 2023 value of $24,359, which represents a total accumulated depreciation of $7,954.13 from an inflation-adjusted original MSRP of $32,313.13.

If you’re in the market for a used vehicle, you can find models with the lowest rates of depreciation by using the My Car’s Value tool provided by Kelley Blue Book. Just input the make, model, year, and mileage of each vehicle you want to get estimates of the trade-in and private-sale value. For further guidance, take a look at our used-car buying checklist.

Methodology

The data we’ve provided in this article relates to the base-level trim for every Mustang model year since 2001. Referring to this trim helps us establish a more reliable baseline because higher trim levels ordinarily include technologies and features that boost a vehicle’s value. Remember also that the COVID-era chip shortage, the condition of your vehicle, and how you sell it can affect the resale value.

Keep in mind, there are large economic factors at play here too and the sale of new cars has caused shifts in the used market too. There is a stark difference in the cost of vehicles due to car manufacturers seeking higher profit margins after COVID as detailed by CNN and posted by CBS channel 58:

“… (T)he auto industry saw sky-high profits even as sales plummeted. Domestic manufacturers of cars and car parts saw a profit of $32 billion through the third quarter of 2022 (the latest data available) — their largest profit since 2016. Car dealerships also reported record-breaking profits through Q3, according to auto-retail advisers Haig Partners.

That’s because pandemic-era pent-up consumer demand remained strong as supply shifted, allowing automakers to increase their prices and their profit margins. Cars and trucks were sold nearly as soon as they hit dealership lots, and the average price paid for a vehicle in December soared to a near-record high of $46,382, according to J.D. Power.

Data from the Labor Department’s November Consumer Price Index shows American consumers are paying about 20% more for cars than they were in 2019.

The trend could continue into next year — research website Edmunds expects new-car sales to hit 14.8 million in 2023, a marginal increase from last year but well below pre-pandemic levels.

The auto industry has entered a new era: Less choice, higher prices and larger profit margins. So far it seems to be working for them.”

This shift by car companies to create higher profit margins by taking advantage of the heavily-reported-on chip shortage panic of COVID has had rebounding effects upon the value of used cars.

Be aware that newer years (the latest 3-4 model years) may be inflated in price because of this and depending on how big this problem is for the model you are considering – it may even be inflating the price of the older model years.

Frequently Asked Questions About Vehicle Depreciation

According to our data, Ford Mustangs do seem to hold their value reasonably well. If we consider that the average vehicle may lose around 60% of its value in five years, the 42.3% depreciation of a 5-year-old Mustang looks pretty good. Remember, though, that certain variables will affect the actual resale value of a vehicle. Aside from age, model year, condition, and color, you should consider the location and the mode of sale.

To get a sense of the impact that these variables can have, let’s use KBB’s My Car’s Value tool to simulate the sale of a silver 2018 Mustang EcoBoost Coupe 2D in good condition with standard options and 60,000 miles. In New York City, this car may get up to $18,913 in a private sale and $17,353 in a trade-in. In Topeka, Kansas, however, you may get slightly more — $19,512 and $17,856, respectively.

Owing to high owner reliability scores and relatively low maintenance costs, we’d say that the 2004, 2007, 2018, and 2020 Mustangs are the best model years to buy. The 2004 and 2007 may be especially good because they land in the ownership sweet spot.

On the other side of the spectrum, we advise against the following model years because of low reliability and potentially expensive maintenance and repair costs:

  • 2001-2003
  • 2006
  • 2008
  • 2013
  • 2017
  • 2019

The definition of high mileage may vary depending on the primary use conditions of a vehicle. For example, vehicles used primarily for pleasure, as the Mustang often is, are likely to clock fewer miles than a daily driver. Based on our owner surveys, though, we find that the average overall mileage for all Mustangs is 95,000, so we can consider that our threshold. Any mileage higher than that can qualify as high mileage.

Buying a Mustang in the 12- to 20-year-old range should help you avoid most of the depreciation. That corresponds with model years 2003 to 2011.

References

(2023). Ford. Consumer Reports. Retrieved September 21, 2023, from https://www.consumerreports.org/cars/ford

(2023). The Best and Worst Car Colors for Resale Value. iSeeCars. Retrieved September 21, 2023, from https://www.iseecars.com/car-color-study

FIXD Research Team

At FIXD, our mission is to make car ownership as simple, easy, and affordable as possible. Our research team utilizes the latest automotive data and insights to create tools and resources that help drivers get peace of mind and save money over the life of their car.

We’re here to help you simplify car care and save, so this post may contain affiliate links to help you do just that. If you click on a link and take action, we may earn a commission. However, the analysis and opinions expressed are our own.

Topics

About the Author

FIXD Research Team

FIXD Research Team

At FIXD, our mission is to make car ownership as simple, easy, and affordable as possible. Our research team utilizes the latest automotive data and insights to create tools and resources that help drivers get peace of mind and save money over the life of their car.

You might also like

Explore Car Resources

car insurance icons

Car Insurance

Find the best insurance deals for your car

Car Buying

Everything you need to know about buying a vehicle

FIXD Team logo

Car Care

Car repair costs, how-to guides, and more

car buying icons

Vehicle Search

Search any make/model for reviews, parts and more