Find the depreciation rate of your Toyota Tundra in the graph below.
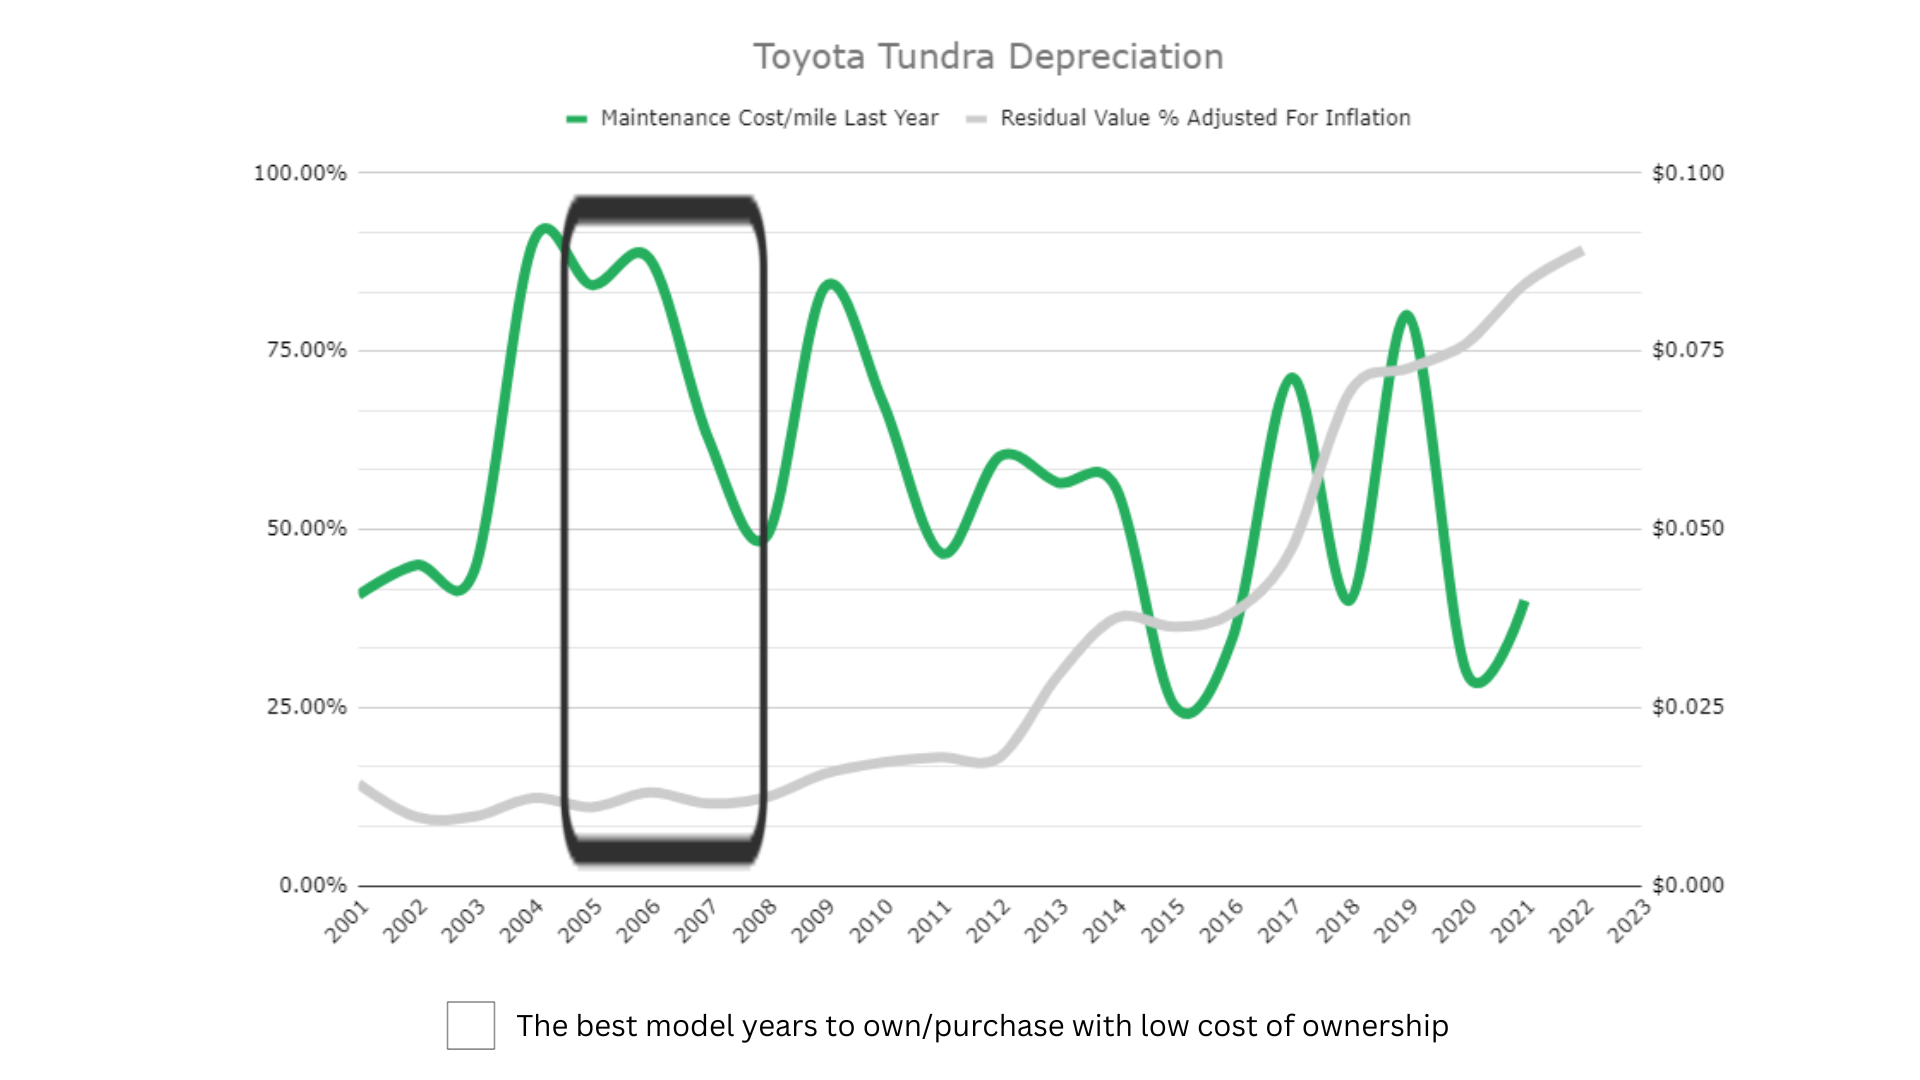
If you’re looking to purchase a new vehicle, know that it starts to depreciate in value as soon as you drive it off the lot. This is also true for Toyota Tundras, as they typically depreciate rapidly after purchase, with the first year of ownership seeing the most loss in value. However, after owning a Toyota Tundra for six years, the steep depreciation will slow down and the car will lose its value less rapidly.
Since the make and model of a vehicle can affect its depreciation, it’s beneficial to learn about the depreciation rate of your specific model and year. This can help you understand how it may keep its value long-term and how much it may cost you throughout your ownership.
Keep in mind that just because the vehicle costs the least to own in the sweet spot we have outlined here, you still may not want to own the vehicle during these depreciation sweet spot years. Although vehicles depreciate less as they get older, they have more repairs. Duh right? However, keep in mind that repairs don’t just cost you money, they cost you time. Reliability is the difference between being able to make it to your destination on time or missing an opportunity because the car broke down.
Check out our article on the best and worst years of the Toyota Tundra to see our reliability ratings for all years of the Tundra between 2001-2022. We also cover MPG, safety ratings, and a number of other factors. We pulled data from Tundras registered in our app and surveyed owners to get you data-backed answers on just how good or bad each year of the Tundra is.
If you want to know the depreciation and maintenance costs for your particular vehicle, use our free “Total Cost of Ownership” tool available in the FIXD App – Android or IOS.
If you like our online tools and articles consider purchasing our FIXD sensor for $19.99 (this is 67% OFF). It’s our flagship product. With it, you scan your car for common engine problems.
If our sensor detects any problems with the engine, our app will clearly explain:
- What could have caused it and
- How much the possible repairs may cost.
If you’d like, we’ll even show you trusted repair shops in your area where you can get your ride fixed through RepairPal. The total cost of ownership feature within the app totals your maintenance costs, repairs, and depreciation (Sensor + App). This is free on the app.
Toyota Tundra Depreciation
| Model Years | Estimated Mileage | (2023 $) Accumulated Depreciation | Residual Value % Adjusted For Inflation | 2023 Value (2023 $) |
| 2001 | 264,000 | $ 16,760.26 | 14.3% | $2,795 |
| 2002 | 252,000 | $ 17,937.76 | 9.6% | $1,912 |
| 2003 | 240,000 | $ 18,194.35 | 9.7% | $1,965 |
| 2004 | 228,000 | $ 18,172.55 | 12.3% | $2,558 |
| 2005 | 216,000 | $ 18,330.77 | 11.0% | $2,272 |
| 2006 | 204,000 | $ 18,178.31 | 13.1% | $2,732 |
| 2007 | 192,000 | $ 25,771.58 | 11.5% | $3,361 |
| 2008 | 180,000 | $ 25,902.95 | 12.4% | $3,677 |
| 2009 | 168,000 | $ 24,905.73 | 15.7% | $4,625 |
| 2010 | 156,000 | $ 24,716.12 | 17.3% | $5,163 |
| 2011 | 144,000 | $ 24,646.47 | 18.0% | $5,395 |
| 2012 | 132,000 | $ 25,463.60 | 18.0% | $5,595 |
| 2013 | 120,000 | $ 21,923.58 | 29.5% | $9,171 |
| 2014 | 108,000 | $ 19,689.21 | 37.6% | $11,867 |
| 2015 | 96,000 | $ 22,440.78 | 36.3% | $12,804 |
| 2016 | 84,000 | $ 23,990.66 | 38.3% | $14,911 |
| 2017 | 72,000 | $ 19,284.51 | 47.2% | $17,206 |
| 2018 | 60,000 | $ 11,648.86 | 69.3% | $26,235 |
| 2019 | 48,000 | $ 10,815.33 | 72.6% | $28,601 |
| 2020 | 36,000 | $ 9,700.70 | 76.1% | $30,808 |
| 2021 | 24,000 | $ 6,060.44 | 84.4% | $32,835 |
| 2022 | 12,000 | $ 4,214.58 | 89.2% | $34,653 |
| 2023 | 0 | N/A | N/A | N/A |
| 2024 | 0 | N/A | N/A | N/A |
The chart above conveys the approximate depreciation for a Toyota Tundra. This information comes from Kelley Blue Book data, and it considers a Tundra in the lowest trim level, with standard features, a generic color such as black, and a mileage of 12,000 miles.
Keep in mind that the auto market was heavily affected in 2020 and beyond. Automakers selling new cars during the COVID pandemic raised prices which caused a spike in demand in the used car market as people tried to save money. Many automakers, however, did not drop prices after the pandemic, they kept them so they could make a larger profit.
This is why the most recent years of many vehicles have seemingly experienced less depreciation. Some, such as 2018-2020 may have even appreciated due to the heightened levels of inflation created.
Factors That Impact the Toyota Tundra Depreciation Rate
Toyota is known for producing high-quality vehicles that hold their value well. The Tundra is no different, as it typically depreciates more slowly than similar vehicles from other manufacturers. This could be due to its resilient design and hardware, which typically require fewer repairs than cars with similar builds. However, the Tundra does still see some depreciation over the years. Here are a few factors that can affect the depreciation rate of a Toyota Tundra:
Age
One factor that can affect a Tundra’s depreciation rate is the age of the vehicle. While the greatest margin of depreciation typically occurs within the first year of ownership, starting as soon as you leave the seller’s premises, Tundras continue to lose value as they age. This is because older vehicles can have more intense wear and damage, and many older models end up requiring costly repairs.
For instance, if you buy a Tundra that’s over 10 years old, it will depreciate as the parts that you need to repair it become obsolete or are replaced in later models for efficiency.
Body Type
A car’s body type can also contribute to how quickly it depreciates in value. One reason is that some body types hold their value better in certain climates. For instance, a pickup truck like the Toyota Tundra may be better equipped to maintain its value in harsh climates with changing weather than a small convertible or sedan. A vehicle’s fuel economy is also tied to its body type, meaning larger vehicles with a worse fuel economy typically depreciate faster than fuel-efficient models with smaller body styles.
Mileage
Mileage refers to the total distance you’ve driven a car throughout your ownership, as shown on your vehicle’s odometer. Since driving regularly contributes to a vehicle’s monthly and yearly average mileage, a car that’s driven often can depreciate more quickly than one that spends a lot of time sitting idle. We base our depreciation calculations on a vehicle with 12,000 miles per driving year, which is fairly average mileage for a car. If you want to maintain your Tundra’s value, try driving it less frequently to keep the mileage as low as possible.
Overall Condition
The vehicle’s overall condition can affect its depreciation rate, as damaged cars are less likely to hold value. When evaluating a vehicle’s condition, consider how efficiently it runs and how new it looks, both on the exterior and interior. If a car shows few signs of damage or obvious repairs, it may be more likely to hold its value. Cars with significant damage typically require more maintenance later, so they’re less valuable during resale. Look for obvious damage, such as dents in the exterior or rips and stains on the interior, to determine the condition of a used vehicle.
Color
Another factor in depreciation is a vehicle’s color. A study found that yellow vehicles typically hold their value the best. Other colors with slower depreciation include beige, orange, green, and red. This may be because the demand for colors like these is higher since they’re less popular among drivers than generic colors such as black or white, which have more options in the market. In contrast, more subtle colors can have a lower resale value overall since they experience higher levels of market saturation resulting from being common choices for drivers who buy new.
Other Costs of Toyota Tundra Ownership
A vehicle’s depreciation rate is just one part of the total cost of ownership. Here are some other costs that drivers can encounter when owning a Toyota Tundra:
Insurance
Some vehicles can cost more money upfront to insure than others, though this is a necessary expense. The average cost to insure a Toyota Tundra is around $1,716 per year, which is lower than the average cost of full-coverage car insurance in the U.S., around $2,014 per year. You can also keep your insurance costs down by driving carefully and avoiding collisions that result in costly repairs.
Maintenance
One of the most important aspects of owning a vehicle is regular maintenance. Ensuring that a vehicle gets serviced regularly can preserve its operability and help it keep its value. The average annual maintenance cost for a Toyota Tundra is around $650, similar to the overall average maintenance cost of other vehicles. However, this figure can rise if you need to take your Tundra in for extra repairs. When buying a Tundra, you can research the best and worst years for the model to determine which year may incur the lowest maintenance costs.
The Best Model Year To Buy a Toyota Tundra
Based on factors including price and reliability (but not depreciation), our choice for the best Toyota Tundra model years to buy are the 2003, 2008, 2011-2014, 2016, 2018-2021, but check out our article on the best and worst years of the Tundra to get the whole story.
Buying a Toyota Tundra New vs. Used
| 20-Year Projection | ||
| Years Since Purchased | Depreciated Value | With Inflation |
| 1 | $34,757 | $38,369 |
| 2 | $32,886 | $38,430 |
| 3 | $29,652 | $34,831 |
| 4 | $28,289 | $33,354 |
| 5 | $27,003 | $31,685 |
| 6 | $18,391 | $21,527 |
| 7 | $14,924 | $17,494 |
| 8 | $14,144 | $16,678 |
| 9 | $14,651 | $17,334 |
| 10 | $11,495 | $13,746 |
| 11 | $7,014 | $8,526 |
| 12 | $7,014 | $8,766 |
| 13 | $6,741 | $8,573 |
| 14 | $6,118 | $7,863 |
| 15 | $4,832 | $6,116 |
| 16 | $4,481 | $5,618 |
| 17 | $5,104 | $6,384 |
| 18 | $4,286 | $5,394 |
| 19 | $4,793 | $5,997 |
| 20 | $3,780 | $4,656 |
Deciding whether to buy a new or used Tundra can be difficult. Still, you can use depreciation data to make the choice easier. For example, the total accumulated depreciation for a used Toyota Tundra is around $9,700.70 after three years of ownership, worth about $30,808 adjusting for inflation. The total accumulated depreciation for a new Tundra after three years of ownership is about $9,312.64, estimated to be around $29,562.
If you’re preparing to buy a used model, use our car buying checklist to determine which traits you need to pay the most attention to ensure that you receive the best deal possible on a high-quality vehicle. For instance, it’s beneficial to ask for a test drive before purchasing a used car so you can see how it runs. You can also complete a thorough inspection on your own to identify any obvious damage or wear that may affect the vehicle’s overall value and maintenance costs.
Methodology
The data represented in this article considers a Toyota Tundra in the base-model trim level with standard options for features and customization. While our data provides insight into the base-level Tundra, you may notice that various trim levels can have different values. This is because some models depreciate at a slower rate when they have advanced add-on options, such as updated technology or more sturdy exterior hardware.
The COVID-era chip shortage can also affect resale values, as well as your vehicle’s overall condition. How you sell your vehicle can help determine its resale value. You can often get a better deal when selling a used Toyota Tundra through a private party instead of trading it in at a dealership.
For example, Kelley Blue Book shows that the resale value range for a black Toyota Tundra in standard trim with 12,000 miles can be $41,291-$44,478 when selling with a private party, while the resale value range for the same vehicle through dealership trade-in is only $27,840-$41,013.
Keep in mind, there are large economic factors at play here too and the sale of new cars has caused shifts in the used market too. There is a stark difference in the cost of vehicles due to car manufacturers seeking higher profit margins after COVID as detailed by CNN and posted by CBS channel 58:
“… (T)he auto industry saw sky-high profits even as sales plummeted. Domestic manufacturers of cars and car parts saw a profit of $32 billion through the third quarter of 2022 (the latest data available) — their largest profit since 2016. Car dealerships also reported record-breaking profits through Q3, according to auto-retail advisers Haig Partners.
That’s because pandemic-era pent-up consumer demand remained strong as supply shifted, allowing automakers to increase their prices and their profit margins. Cars and trucks were sold nearly as soon as they hit dealership lots, and the average price paid for a vehicle in December soared to a near-record high of $46,382, according to J.D. Power.
Data from the Labor Department’s November Consumer Price Index shows American consumers are paying about 20% more for cars than they were in 2019.
The trend could continue into next year — research website Edmunds expects new-car sales to hit 14.8 million in 2023, a marginal increase from last year but well below pre-pandemic levels.
The auto industry has entered a new era: Less choice, higher prices and larger profit margins. So far it seems to be working for them.”
This shift by car companies to create higher profit margins by taking advantage of the heavily-reported-on chip shortage panic of COVID has had rebounding effects upon the value of used cars.
Be aware that newer years (the latest 3-4 model years) may be inflated in price because of this and depending on how big this problem is for the model you are considering – it may even be inflating the price of the older model years.
Frequently Asked Questions About Vehicle Depreciation
Do Toyota Tundras Hold Their Value?
The Toyota Tundra typically holds its value very well compared to similar pickup trucks. This may be due to the model’s resilient build and sturdy make. However, some caveats can affect a Tundra’s resale value, such as the trim level you choose and the insurance policy you use to cover it. The maintenance required for a Toyota Tundra can also cause it to depreciate more quickly, especially if you experience damage from accidents or collisions. The Tundra doesn’t have the best fuel economy, which can result in higher fuel costs.
What Are the Best Years of the Toyota Tundra To Buy, and Which Ones Should You Avoid?
The best years of the Toyota Tundra to buy used are those from 2003, 2008, 2011-2014, 2016, and 2018-2021. This is because drivers report that vehicles from these years maintain high reliability scores. Tundras from these years have also shown lower needs for repairs, saving drivers money on maintenance. With reliable fuel economy, these years can also help drivers save on fuel costs as opposed to years with lower fuel efficiency.
Regarding the worst years for the Toyota Tundra, avoid buying models from 2001-2002, 2004-2007, 2009-2010, 2015, and 2017. Tundras from these years depreciate at a much higher rate, largely due to the overall age of the models, especially for years from 2001-2007. Drivers also report that Tundras from these years are often expensive to repair, which lowers their overall reliability. Other issues found in Tundras from these periods include powertrain malfunctions and low-reliability scores.
What's High Mileage for a Toyota Tundra?
In terms of mileage, a Toyota Tundra is typically considered to have high mileage when it reaches around 200,000 miles on the odometer. For model years between 2000 and 2021, the average mileage for the Tundra is around 140,000 miles. If you have a Tundra with over 140,000 miles on it, you may have difficulty getting a high resale value, especially if it reaches close to 200,000 miles.
How Old of a Toyota Tundra Should You Buy To Avoid Most of the Depreciation?
As the sweet spot for buying a used Toyota Tundra is the range of model years from 2005-2008, you can typically avoid overtly rapid depreciation by purchasing one from these periods. To stay at least a year within the sweet spot, you can purchase a 2006 model.
References
(2023.) Best & Worst Years of Toyota Tundra – Graphs & Owner Surveys. FIXD. Retrieved August 24, 2023, from https://www.fixdapp.com/car-reviews/best-worst-years-of-toyota-tundra-graphs-owner-surveys/
(2023.) What Is Car Depreciation? Progressive. Retrieved August 24, 2023, from https://www.progressive.com/answers/what-is-car-depreciation/
(2023.) Toyota Tundra Depreciation. CarEdge. Retrieved August 24, 2023, from https://caredge.com/toyota/tundra/depreciation
(2023.) How Does Age Affect a Car’s Value? Team Auto Depot. Retrieved August 24, 2023, from https://www.autodepotsudbury.ca/blog/how-age-affects-car-value/
(2023.) The Best and Worst Car Colors for Resale Value. iSeeCars. Retrieved August 24, 2023, from https://www.iseecars.com/car-color-study
(2023.) Average Cost of Car Insurance in August 2023. Bankrate. Retrieved August 24, 2023, from https://www.bankrate.com/insurance/car/average-cost-of-car-insurance/
(2023.) My Car’s Value 2021 Toyota Tundra Crewmax. Kelley Blue Book. Retrieved August 24, 2023, from https://www.kbb.com/toyota/tundra-crewmax/2021/sr5-pickup-4d-5-1-2-ft/?condition=good&intent=trade-in-sell&mileage=12000&modalview=false&options=9778025%7ctrue&pricetype=trade-in&vehicleid=450929
(2021.) 12 Factors That Affect Your Car’s Resale Value. Money Crashers. Retrieved August 24, 2023, from https://www.moneycrashers.com/factors-affect-used-cars-resale-value/

At FIXD, our mission is to make car ownership as simple, easy, and affordable as possible. Our research team utilizes the latest automotive data and insights to create tools and resources that help drivers get peace of mind and save money over the life of their car.

