Search
Close this search box.
Search
Close this search box.

Toyota Camry | Depreciation Rate & Curve Graphed

On average, the Toyota Camry loses 38.3% of its value in the first five years. Based on the depreciation curve and maintenance cost per mile, we place the ownership sweet spot for the Camry as the 2005-2013 model years. To get at least five years in the sweet spot, do not buy anything older than a 2009.

New Toyota Camry in white colour. Luxury business limousine cruising the streets.
TABLE OF CONTENTS

Find the depreciation rate of your Toyota Camry in the graph below.

A chart showing the depreciation of the Toyota Camry. It shows the best time to own/purchase a Toyota Camry

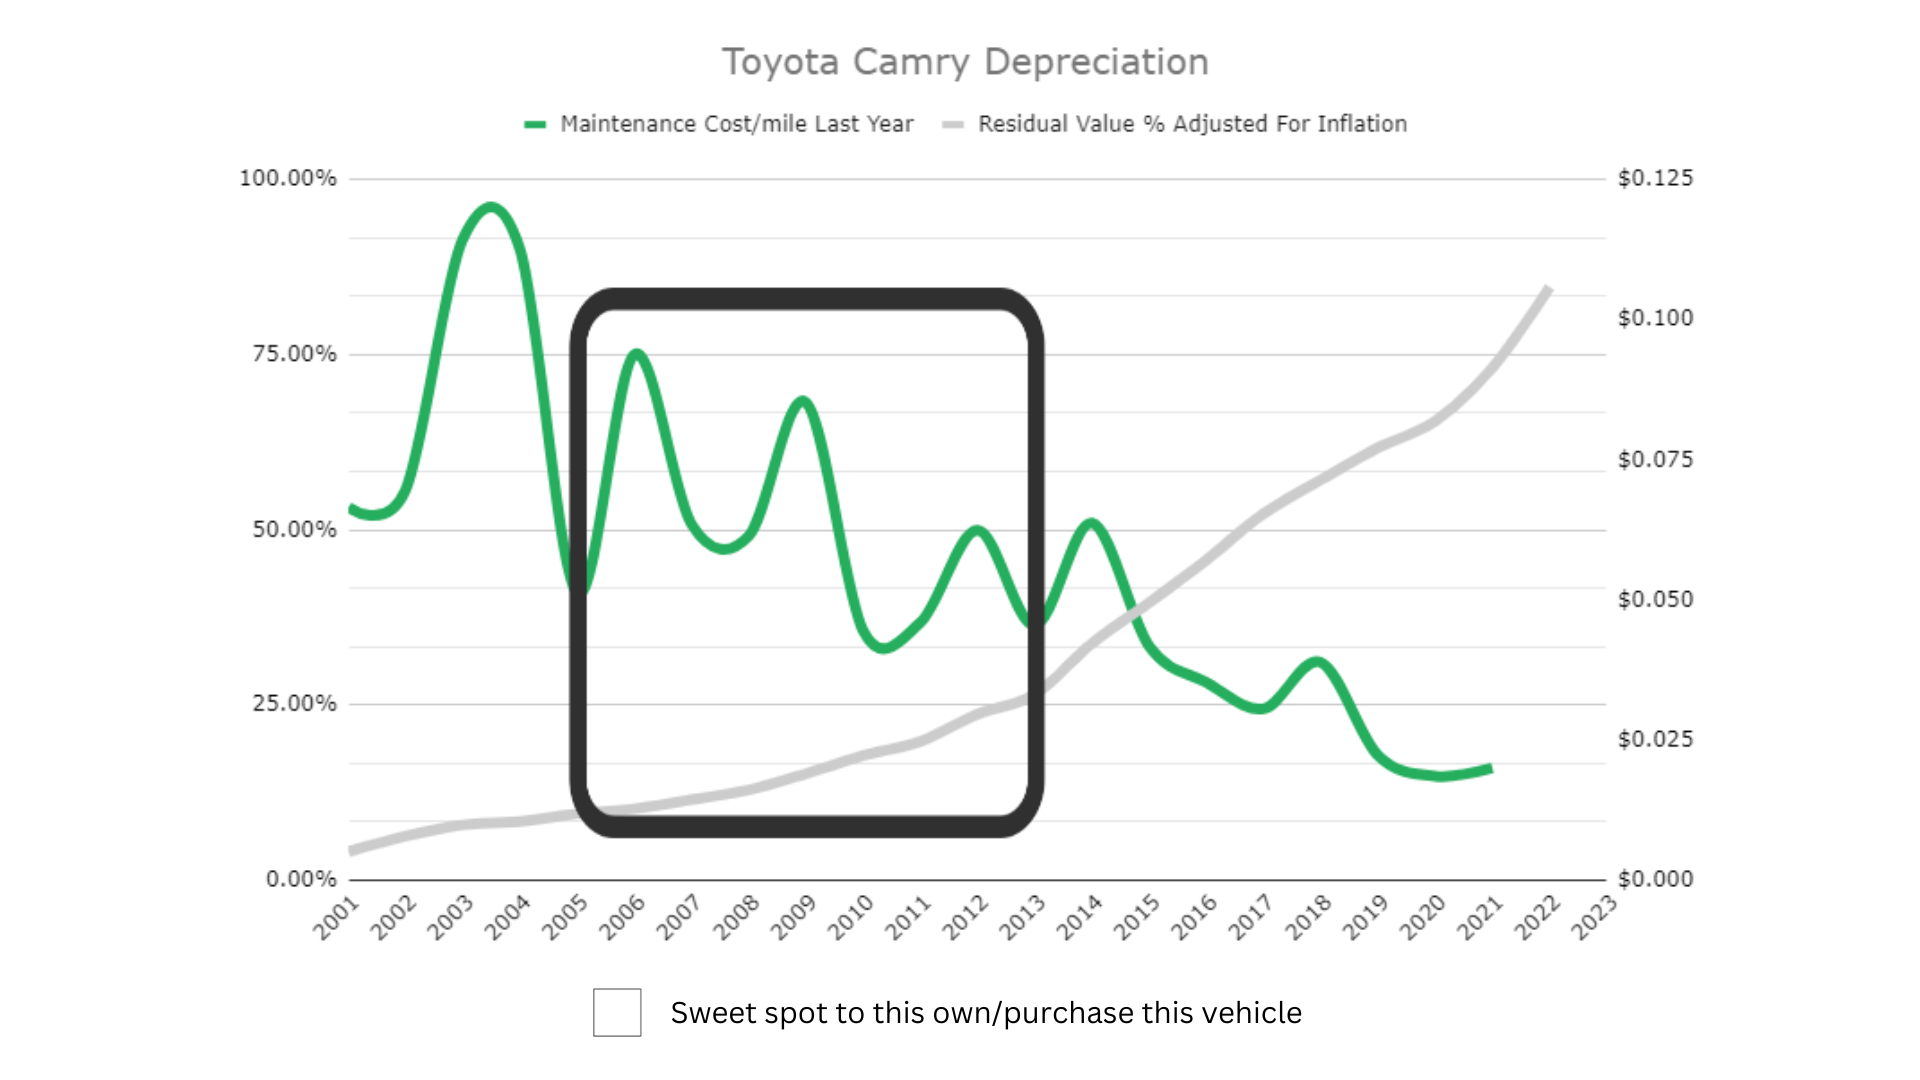
You probably know that a new vehicle begins to depreciate or lose value the moment you purchase it and drive it off the lot. Like all vehicles, the Toyota Camry experiences this same depreciation. The most significant depreciation occurs in the first year of owning the vehicle. The car then depreciates more slowly each year until it reaches the eight-year mark. Different makes and models depreciate at varying rates. By knowing the depreciation rate of a specific vehicle, you can make an informed purchasing decision based on its long-term value and total ownership costs.

Keep in mind that just because the vehicle costs the least to own in the sweet spot we have outlined here, you still may not want to own the vehicle during these depreciation sweet spot years. Although vehicles depreciate less as they get older, they have more repairs. Duh right? However, keep in mind that repairs don’t just cost you money, they cost you time. Reliability is the difference between being able to make it to your destination on time or missing an opportunity because the car broke down.

Check out our article on the best and worst years of the Toyota Camry to see our reliability ratings for all years of the Camry between 2001-2021. We also cover MPG, safety ratings, and a number of other factors. We pulled data from Camrys registered in our app and surveyed owners to get you data-backed answers on just how good or bad each year of the Camry is.

If you want to know the depreciation and maintenance costs for your particular vehicle, use our free “Total Cost of Ownership” tool available in the FIXD App – Android or IOS.

If you like our online tools and articles consider purchasing our FIXD sensor for $19.99 (this is 67% OFF). It’s our flagship product. With it, you scan your car for common engine problems.

If our sensor detects any problems with the engine, our app will clearly explain:

  1. What could have caused it and
  2. How much the possible repairs may cost.


If you’d like, we’ll even show you trusted repair shops in your area where you can get your ride fixed through RepairPal. The total cost of ownership feature within the app totals your maintenance costs, repairs, and depreciation (Sensor + App). This is free on the app.

Toyota Camry Depreciation

Model YearsMileageAmount DepreciatedResidual Value PercentageResale Value
2001264,000$24,216.524.1%$1,028
2002252,000$22,614.086.3%$1,516
2003240,000$22,573.437.9%$1,933
2004228,000$22,655.438.4%$2,090
2005216,000$21,094.609.5%$2,207
2006204,000$21,437.3910.2%$2,437
2007192,000$23,035.5711.5%$3,006
2008180,000$23,151.1812.9%$3,423
2009168,000$22,937.0515.2%$4,112
2010156,000$22,116.7617.8%$4,788
2011144,000$21,195.4319.8%$5,225
2012132,000$21,190.5023.7%$6,590
2013120,000$20,358.7726.5%$7,346
2014108,000$18,289.6833.8%$9,322
201596,000$16,793.2639.6%$11,008
201684,000$15,128.1345.7%$12,752
201772,000$13,330.4152.3%$14,619
201860,000$12,533.3557.1%$16,683
201948,000$11,756.0961.7%$18,928
202036,000$10,732.0665.5%$20,396
202124,000$8,278.4173.1%$22,496
202212,000$4,302.8784.6%$23,574
20230N/AN/AN/A
20240N/AN/AN/A

This chart shows the approximate depreciation for a Toyota Camry. It’s based on Kelley Blue Book data since 2001, assuming a vehicle in a standard trim, a generic color such as black or white, and a mileage of 12,000 per year.

Keep in mind that the auto market was heavily affected in 2020 and beyond. Automakers selling new cars during the COVID pandemic raised prices which caused a spike in demand in the used car market as people tried to save money. Many automakers, however, did not drop prices after the pandemic, they kept them so they could make a larger profit.

This is why the most recent years of many vehicles have seemingly experienced less depreciation. Some may have even appreciated due to the heightened levels of inflation created.

Factors That Impact the Toyota Camry Depreciation Rate

Colorful arrows on white background №5

Among the top auto manufacturers, Toyota has a longstanding reputation for building safe, reliable vehicles. Its cars consistently receive high marks for reliability and investment value. For these reasons, many Toyota vehicles often have excellent resale values over long periods. Besides Toyota’s reputation, here are some other factors that may affect the depreciation rate and resale value of your Camry.

The age of your Camry is one of the top factors that can affect its depreciation rate. A vehicle’s age refers to its model year, which tells you its generation and pricing, not necessarily its manufacture date. In outgoing model years, a vehicle depreciates as the auto manufacturer releases a new version of the vehicle. Most automakers fully redesign their cars every few years, which means some model years may have different safety ratings or reliability concerns. Often, the model year of your Camry can end up being the most significant factor in its depreciation and resale value.

Body type, also known as body style, classifies a vehicle based on size and shape. Some popular body types include sedans, coupes, hatchbacks, sports cars, sport-utility vehicles, station wagons, minivans, and pickup trucks. Typically, SUVs and pickup trucks have the slowest depreciation rates, while luxury sedans usually depreciate more quickly than other body styles.

The Toyota Camry is a full-size sedan with seating for five passengers. Economy sedans such as the Camry usually depreciate faster than pickups and SUVs, but they retain their value better than luxury sedans. Market trends can influence the depreciation rates of certain vehicles, so if demand grows for sedans and other compact cars, they may hold their value longer. Other factors, such as geography and fuel economy, can also impact the depreciation of body styles. For example, vehicles with better fuel efficiency, including sedans, often experience lower depreciation when gas prices increase.

Your car’s mileage can also impact its depreciation rate. The average person drives around 1,000 miles monthly, so we base our model on 12,000 miles yearly. If you drive more or less than that average, it can affect your car’s value. For example, if you put thousands of miles on your car each month, it may wear more quickly and require additional maintenance or repairs. Usually, this causes your car to depreciate more quickly. However, if you only drive a few hundred miles per month, this lower mileage may slow your car’s depreciation rate.

Your vehicle’s overall condition includes both its looks and its mechanics. A vehicle’s maintenance and service history can contribute to its overall condition. If you follow your Toyota Camry’s routine maintenance schedule, avoid major damage, and minimize wear and tear to the interior and exterior, you may increase its value when you’re ready to trade it in or sell it.

On the other hand, if your car experiences high wear and tear, it can depreciate faster. It’s also important to note that your vehicle may not be worth fixing at some point if it requires advanced maintenance or significant repairs. That’s because the car may be worth less than the cost of fixing it. Make sure to consider this factor so you’re not spending money you won’t earn back.

Your vehicle’s color may not be the first factor you consider when you think about its value, but it can affect its depreciation rate. A study by iSeeCars found that cars in rarer colors, including yellow, orange, and green, have the highest resale values. That’s likely because fewer cars in those colors are on the road, contributing to higher demand. According to the study, neutral beige is also one of the lowest-depreciating vehicle colors.

In contrast, popular colors such as black, brown, and gold may depreciate at an average or slightly above-average rate because so many are available. While color shouldn’t be your top concern related to depreciation, it’s a factor you can consider if you want to get the highest possible resale value for your Camry.

Other Costs of Toyota Camry Ownership

Your vehicle’s depreciation rate is just one factor to consider when determining the total cost of ownership. Here are some other costs of owning a Toyota Camry.

Insurance

Insurance rates differ among vehicles, and some cars cost more to insure than others. Factors such as the vehicle’s safety features and body type can influence the cost of your premiums. Your driving history and habits can also affect your insurance rate.

In general, the Toyota Camry has average insurance costs for most drivers. It will cost you around $622 per year for minimal coverage and $2,014 per year for full coverage, according to Bankrate. That’s the same amount as the national average cost of car insurance since Bankrate uses the Camry as its base vehicle because of its immense popularity.

However, where you live can also impact how much you pay for insurance on a Toyota Camry. For example, in Missouri, it costs an average of $48.30 per month for liability and $109.59 per month for full coverage, making the Camry one of the cheapest vehicles to insure in the state.

Maintenance

With routine maintenance, you can keep your Toyota Camry in good condition and running smoothly for years to come. On average, repair costs for a Toyota Camry are $617 per year. That’s slightly lower than the average for other small and midsize sedans, which cost about $650 per year to maintain, including scheduled routine maintenance and repairs.

Remember that some model years of the Toyota Camry may have higher maintenance costs than others. Specifically, these model years of the Camry may be more expensive to maintain due to higher-cost engine repairs, which can accelerate the depreciation process:

  • 2003
  • 2004
  • 2006
  • 2009

The Best Model Year To Buy a Toyota Camry

Based on factors including price and reliability (but not depreciation), our choice for the best Toyota Camry model years to buy are 2008-2009, 2012, and 2014-2015, but check out our article on the best and worst years of the Camry to get the whole story.

Purchasing a Camry within those model years will get you in the sweet spot based on residual value after depreciation. The 2008 and 2009 model years get top marks for reliability and safety, while the later years offer maximum gas-powered and hybrid efficiency.

Buying a Toyota Camry New vs. Used

20-Year Projection Table
20-Year Projection
Years Since PurchasedProjected ValueWith Inflation
1$22,267$24,581
2$19,240$22,483
3$17,240$20,251
4$16,239$19,147
5$15,029$17,635
6$13,765$16,112
7$12,028$14,100
8$10,423$12,290
9$8,896$10,525
10$6,975$8,341
11$6,238$7,583
12$5,211$6,513
13$4,685$5,958
14$4,001$5,142
15$3,395$4,298
16$3,027$3,795
17$2,685$3,358
18$2,500$3,147
19$2,211$2,766
20$2,079$2,562

A 2023 Toyota Camry has a starting MSRP of $26,320. It’s projected to be worth $19,240 in two years, depreciating a total of $7,080. In contrast, a 2021 Camry has a current resale value of $22,496, accounting for an accumulated depreciation of  $8,278.41 over two years. For this reason, purchasing a used Camry, particularly one in the sweet spot, can often be more economical than purchasing a brand-new model.

When deciding to purchase a used Camry, do your research to understand the depreciation rate and resale value of the model year you’re considering. You can use Kelley Blue Book to help you determine the value of a used Camry. In addition, consider other ownership costs, such as insurance and maintenance, to help you make the right choice and get the most value for your money.

Methodology

The data we used applies to the base trim for the Toyota Camry with standard features. Upper trims or models with additional packages and options may have different values than the ones presented here. In fact, those features may contribute to a higher resale value. Other factors, such as the condition of the vehicle and whether you sell it privately or through a dealer, can affect the resale value of your Camry. In addition, the COVID-era chip shortage may still affect the resale values of used cars in the marketplace.

Keep in mind, there are large economic factors at play here too and the sale of new cars has caused shifts in the used market too. There is a stark difference in the cost of vehicles due to car manufacturers seeking higher profit margins after COVID as detailed by CNN and posted by CBS channel 58:

“The auto industry saw sky-high profits even as sales plummeted. Domestic manufacturers of cars and car parts saw a profit of $32 billion through the third quarter of 2022 (the latest data available) — their largest profit since 2016. Car dealerships also reported record-breaking profits through Q3, according to auto-retail advisers Haig Partners.

That’s because pandemic-era pent-up consumer demand remained strong as supply shifted, allowing automakers to increase their prices and their profit margins. Cars and trucks were sold nearly as soon as they hit dealership lots, and the average price paid for a vehicle in December soared to a near-record high of $46,382, according to J.D. Power.

Data from the Labor Department’s November Consumer Price Index shows American consumers are paying about 20% more for cars than they were in 2019.

The trend could continue into next year — research website Edmunds expects new-car sales to hit 14.8 million in 2023, a marginal increase from last year but well below pre-pandemic levels.

The auto industry has entered a new era: Less choice, higher prices and larger profit margins. So far it seems to be working for them.”

This shift by car companies to create higher profit margins by taking advantage of the heavily-reported-on chip shortage panic of COVID has had rebounding effects upon the value of used cars.

Be aware that newer years (the latest 3-4 model years) may be inflated in price because of this and depending on how big this problem is for the model you are considering – it may even be inflating the price of the older model years.

Frequently Asked Questions About Vehicle Depreciation

In general, the Toyota Camry holds its value over time, though various factors can affect the resale value of your specific model. In addition to factors such as age, mileage, and condition, how you sell your Camry can also impact the amount you get for it.

For example, if you have a black 2021 Toyota Camry LE in good condition with standard equipment, a dealer will give you an average trade-in value of $21,204. If you sell the same car privately, the average value is $23,821, according to Kelley Blue Book.

When you consider the rate of depreciation and factors such as safety and maintenance costs, the best years to buy a Toyota Camry are 2012, 2014, and 2015. These model years offer good reliability, safety, and efficiency, helping them to retain their value.

Here are the Toyota Camry model years to avoid if you’re planning to buy a used one:

  • 2001-2002
  • 2003-2005
  • 2006-2007
  • 2010-2011

These model years were plagued by low efficiency, engine problems, and lower safety ratings. You may spend more on maintenance costs and repairs if you choose a Camry within these years.

Over 20 years, Camry owners have an average of 143,000 miles, with older cars running towards 190,000. For this reason, the 200,000-mile mark could be considered high for the Camry.

All the 2001 through 2005 model years make our list of worst Camrys for various reasons, but they also average 175,000 miles. On whether the Camry will run past 200,000 miles, 20% of 2001 owners say no, a figure that jumps to 32% for 2005 owners.

That being said, an older Camry with 200,000 miles of highway driving and regular maintenance is likely better qualified to keep going than a newer model with 100,000 city miles and a poor service history. So, do your homework before buying any Camry to get a complete picture of how those miles genuinely add up.

To avoid most of the depreciation, buy a Toyota Camry between the model years 2009-2014. That will allow you to take full advantage of this vehicle’s sweet spot for depreciation.

References

(2022.) New Cars You Can Count On: Highlights From Consumer Reports’ Latest Car Reliability Survey. Consumer Reports. Retrieved Aug. 2, 2023, from https://www.consumerreports.org/cars/car-reliability-owner-satisfaction/new-cars-you-can-count-on-latest-car-reliability-survey-a9891586663/

(2020.) Toyota Named Number 1 Motor Vehicle Company on Fortune Magazine’s 2020 “World’s Most Admired” List. Toyota Newsroom. Retrieved Aug. 2, 2023, from https://pressroom.toyota.com/toyota-named-number-1-motor-vehicle-company-on-fortune-magazines-2020-worlds-most-admired-list/

(2021.) 12 Factors That Affect Your Car’s Resale Value. Money Crashers. Retrieved Aug. 2, 2023, from https://www.moneycrashers.com/factors-affect-used-cars-resale-value/

(2023.) Average Miles Driven Per Year: Why It Is Important. Kelley Blue Book. Retrieved Aug. 2, 2023, from https://www.kbb.com/car-advice/average-miles-driven-per-year/

FIXD Research Team

At FIXD, our mission is to make car ownership as simple, easy, and affordable as possible. Our research team utilizes the latest automotive data and insights to create tools and resources that help drivers get peace of mind and save money over the life of their car.

We’re here to help you simplify car care and save, so this post may contain affiliate links to help you do just that. If you click on a link and take action, we may earn a commission. However, the analysis and opinions expressed are our own.

Topics

About the Author

Picture of FIXD Research Team

FIXD Research Team

At FIXD, our mission is to make car ownership as simple, easy, and affordable as possible. Our research team utilizes the latest automotive data and insights to create tools and resources that help drivers get peace of mind and save money over the life of their car.

You might also like

Explore Car Resources

car insurance icons

Car Insurance

Find the best insurance deals for your car

Car Buying

Everything you need to know about buying a vehicle

FIXD Team logo

Car Care

Car repair costs, how-to guides, and more

car buying icons

Vehicle Search

Search any make/model for reviews, parts and more