Toyota Camry MPG, Engine Reliability Score, & Safety Ratings Year by Year
Before we go deep on why certain years of the Toyota Camry are better than others, it’s important to explain how we got there. The graphs below illustrate engine reliability, how the Camry fared in the NHTSA safety testing protocol, and fueleconomy.gov.
If you’re in the market for a car, take a look at our article on the USAs’ most reliable and cheapest to repair cars in the U.S. Don’t get stuck with a lemon, use our data to help you shop.
Engine Reliability Score – Over The Years
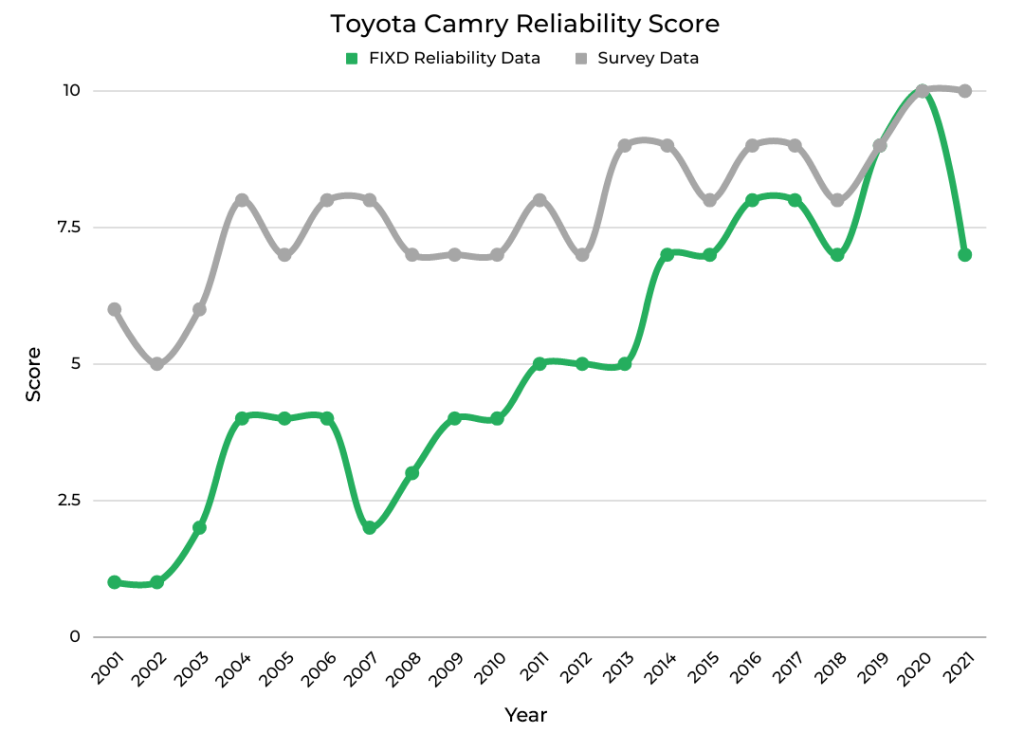
This chart of engine reliability displays data from two sources.
The green FIXD Engine Reliability score comes from the number of Toyota check engine lights (CEL) recorded by each model year in our app and is then weighted by mileage. This score is objective.
The gray line on this chart comes from surveyed Camry owners feedback. The survey asked individuals to rate how reliable their model year is based on whether they think it will only get them from point A to point B or across the country – with additional options between those extremes. This score is subjective.
The scores for the FIXD data and the surveyed data are both relative scores where 5 is average, 10 is the highest, and 1 is the lowest.
Looking from 2001 forward – to align with the published safety, fuel economy, and resale value figures – you can see that the two sets of data generally move in similar directions with a handful of notable exceptions. For example, the 2007 Camry shows a FIXD reliability score of 2 (part of why we don’t recommend it) versus the owner survey score of 8.
2007 was the first year of a new generation, which commonly causes initial production hiccups, but 2007 also had an exceptionally high number of CELs for Diagnostic Trouble Code (DTC) B1242. This translates to an issue with the wireless door lock circuit that may make it hard or impossible for you to unlock or lock your car. Owners may not naturally associate this as a reliability issue, leading to a higher survey reliability score even though it may prevent them from driving. There is a similar issue at play regarding the gap in scores between 2010 and 2011 too, we’ll discuss below.
One other notable exception on this chart is how the FIXD score drops from 10 in 2020 to 7 for 2021. This is due to very few 2021 Toyota Camrys having the FIXD device installed, which results in a relatively small sample size but does not necessarily indicate poor reliability. People who have car problems buy OBD2 scanners like FIXD. In small test pools, this can skew the data towards lower reliability scores. We expect this score to improve over time as more owners install the FIXD device.
The FIXD Reliability score is based on Check Engine Light (CEL) frequency. Every time your CEL goes on, a Diagnostic Trouble Code (DTC) is generated. These help the mechanic determine what’s wrong with the engine. If you’re curious, we put together a cheatsheet with the Top 5 DTCs (& what they mean) for the top Toyota models.
NHTSA Safety Score – Over The Years
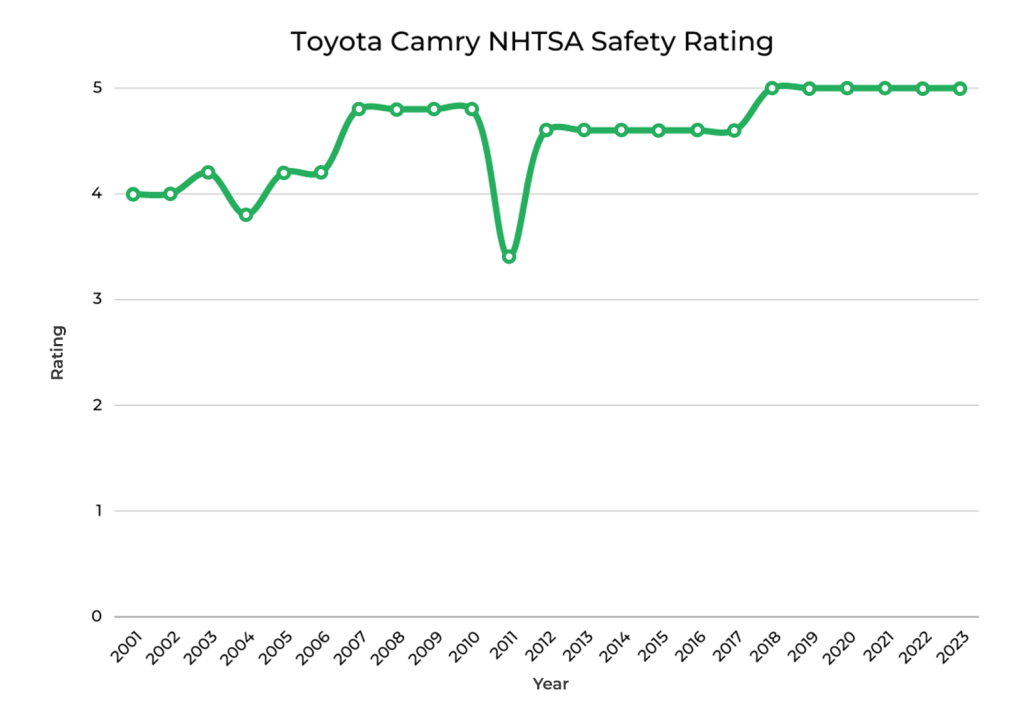
As you can see looking at this chart of the National Highway Transportation Safety Administration (NHTSA) averaged safety scores for the Toyota Camry year-over-year, the Camry generally does very well. With a score of 4 or higher on most years between 2001 and 2017 – with some noticeable caveats in 2004 & 2011 – and top marks every year since 2018, most years of this car score very well for safety.
In 2004, the overall NHTSA safety score dips below 4, which lands it on our list of Camry’s not to buy as we detail below. For 2011, NHTSA modified how they performed the safety testing – to make it more strenuous – which largely explains the significant drop by the Camry that year.
Again, vehicle safety scores are worth understanding as they go hand-in-hand with how much you’ll pay for auto insurance. If you live in one of the states listed below, we can show you the cheapest vehicles to insure in yours. This is another cost to take into consideration when buying a car.
| What Used Cars Are the Cheapest To Insure In: |
| Ohio |
| North Carolina |
| Michigan |
| Georgia |
| Texas |
| New York |
| Illinois |
| Pennsylvania |
| California |
MPG – Over The Years
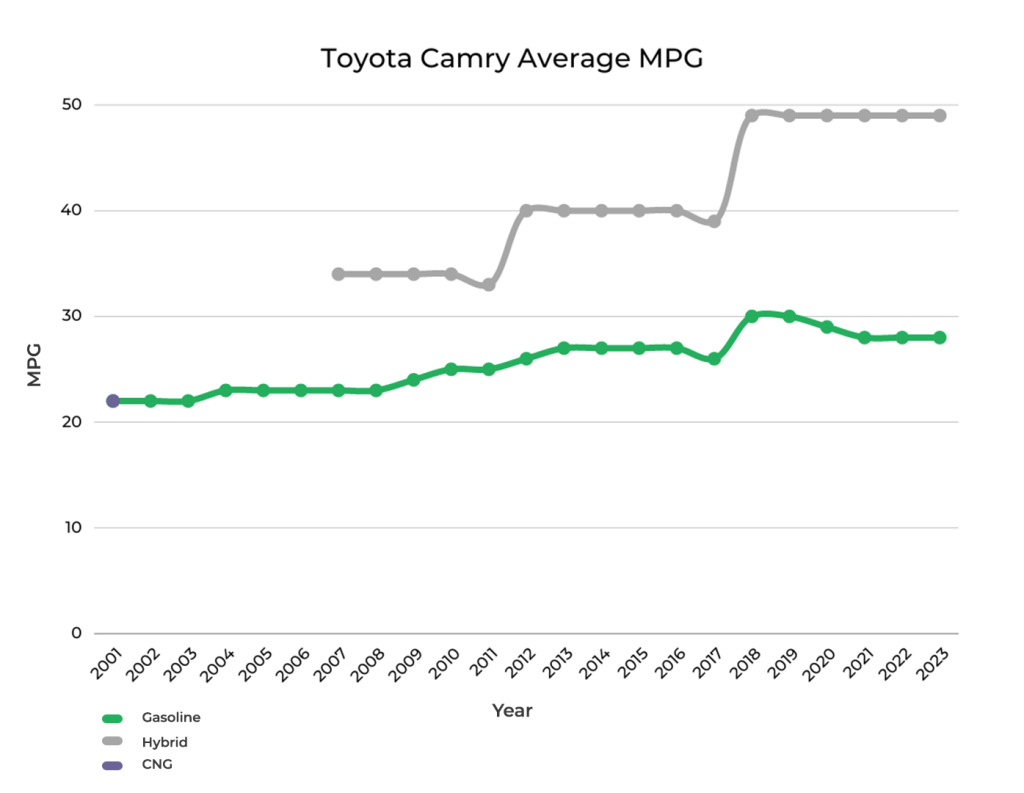
Looking over these U.S. Department of Energy estimated fuel economy figures, we can see the Toyota Camry has mostly shown a steady improvement in this category. It wasn’t until 2010 that the Camry averaged 25 mpg, which plays a part in why earlier models receive a thumbs down from us.
The slight drop in 2017, only a single mpg, does not have an obvious cause as this was the final model year of generation seven with no changes that clearly impact fuel economy. However, the way this average tails off after 2018 can be explained by the addition of the performance-oriented TRD variant and available AWD running gear.
For those looking to stretch a gallon of gas, the hybrid powertrain fuel economy figures follow a clear trend of generational improvements. Starting with gen-six in 2007, the hybrid models perform more than 10 mpg better, on average, than the traditional gas-powered Camry. The following generation kicks off in 2012 with a jump in hybrid efficiency to 40 mpg and once again we see this happen in 2018 with the current hybrid Camry rated at 49 mpg on average.
When shopping for a used Toyota Camry, it’s important to keep in mind that not all vehicles are cared for equally. To protect yourself from lemons, take along a FIXD Sensor on your test drive. FIXD connects to a free app on your smartphone to tell you more about the vehicle you’re checking out, including check engine lights and other hidden issues that the owner or dealership may be attempting to hide. Click here to learn more and get FIXD for only $19.99 (regular price $59)!
Current Market Value of All Toyota Camry Years & Cost Per Year to Repair and Maintain Each
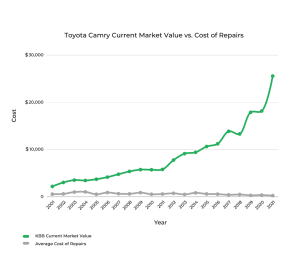
On the whole, the Toyota Camry follows a typical pattern of decreasing in market value as it ages. Fortunately, the annual service costs stay low with an average of $617 spent between 2001 and 2021. Camrys from 2003 and 2004 however have $1,000 in annual maintenance and repair costs due to higher-cost engine repairs that we’ll dive into below. A corresponding drop in market value helps land these model years on our list of Camrys to avoid.
As is often the case, the first year of a new generation brings issues that need ironing out. The roughly $500 drop in market value from 2017 to 2018 can be attributed to this as 2018 is year one of the current Camry series. It correlates with a drop in the engine reliability score produced by owner surveys.
If you’d like to learn about this vehicle’s past depreciation rate & our projected depreciation rate based on that, check out: Toyota Camry | Depreciation Rate & Curve Graphed
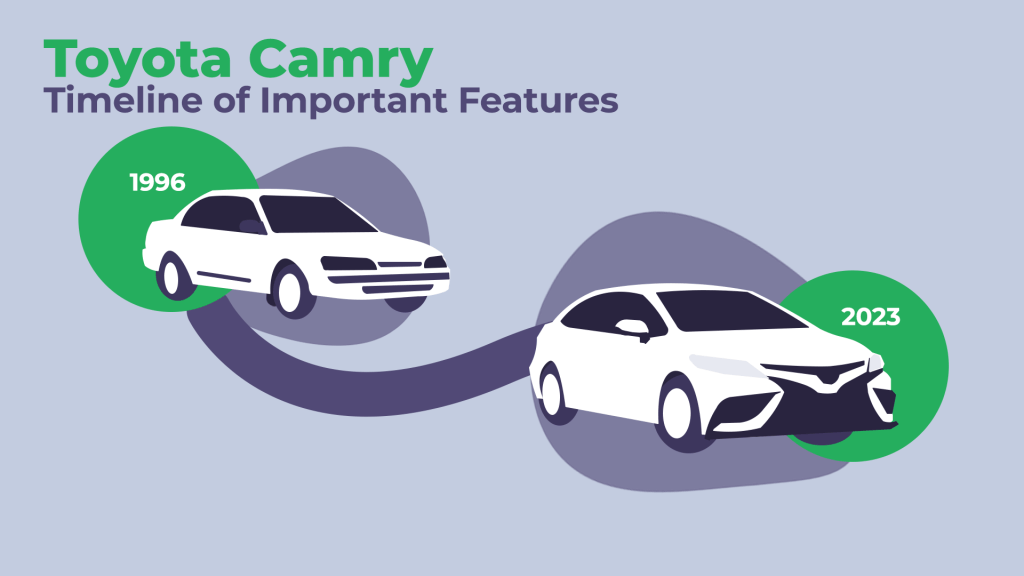
Important Features Timeline
The Best Years of the Toyota Camry
We’ve analyzed data on engine reliability, government crash test scoring, fuel economy, and owner survey responses to rank the best model years of the Toyota Camry. Current market values are also noted here along with any relevant recall information and diagnostic trouble codes (DTC) you need to be aware of.
2020-2021 Toyota Camry
- FIXD Reliability Score: 10/10
- Owner Reliability Score: 10/10
- KBB Value: $18,161-$25,559
- Fuel Economy: 28-29 mpg
- Annual Maintenance/Repair: $250-361
- Safety Rating: 5/5
It’s perhaps not surprising that the newest Camry model years we have data for, 2020-2021, rank highest. However, credit to Toyota for their clear effort to always be improving, which clearly shows in the data. Owners ranked both years a 10 out of 10 for reliability and the FIXD data came back at its highest level for 2020 with a 10 out of 10.
The sharp drop in the FIXD data for 2021 can be attributed to a small sample size and we expect it will rise as more owners install the FIXD device.
Other highlights include top NHTSA safety scores and an average fuel economy near 30 mpg for gas-powered models or 49 with the hybrid. One ding against the 2020 Camry is that 38% of owners think the seats are uncomfortable. Some of that may be due to the sportier TRD trim that arrived in 2020 with more aggressive seat bolstering.
Annual repair cost comes in at just $250 for the 2021 model, which is the lowest of any Camry in over 20 years. As well, owners report zero days in the shop. There are no open recalls for 2021, but there are two for 2020, one of which is related to the fuel pump and affects more than 1.5 million Camrys per the NHTSA. Getting these active recalls fixed is free at a Toyota dealership.
Check engine lights are few and far between on the 2020 and 2021 Camry however, the most common one is DTC P0031. Related to an issue with the oxygen sensor, it shouldn’t prevent you from driving. That being said, it can lead to bigger problems if left unresolved. Expect to pay less than $300 for a new sensor but upwards of $1,000 for wiring work.
The second most common reason behind a CEL on these model year Camrys is DTC P0302. Caused by a cylinder misfire, this is a more serious problem that you’ll want to address immediately. Watch our video for a detailed explanation of what to expect when this code appears.
2016-2019 Toyota Camry
- FIXD Reliability Score: 7-9/10
- Owner Reliability Score: 8-9/10
- KBB Value: $11,212-$17,884
- Fuel Economy: 26-30 mpg
- Annual Maintenance/Repair: $313-$558
- Safety Rating: 4.6-5/5
Looking at the engine reliability chart for 2016 to 2019, we see a dip in owner survey data for 2018. That was the first model year for the current generation, which is a known hang-up for most cars as the automaker works out any kinks. Toyota looks to have followed that path as reliability moves back up the following year.
The other side of this coin is how the average safety score steps up from 4.6 to the top score of 5. For 2018, Toyota made their suite of advanced driver aids standard across the lineup with systems like forward collision mitigation and lane departure warning.
As part of the 2018 overhaul, Toyota also introduced Entune 3.0, a more advanced infotainment system that clearly some like and some don’t which is to be expected with any new technology. There is a jump in owner discontent around using the entertainment system from 6% in 2017 to 22% in 2018. However, 27% reported the 2018 system was easy to use. Tricky to say if it’s good or bad.
Infotainment systems are a divisive issue, not just for the Camry owners but many other model owners we’ve surveyed too, so play around with the system before you buy. Who knows, you might hate it.
It’s in this stretch of years that average Camry fuel economy hits 30 mpg and the hybrid approaches 50 mpg from 2018 forward. Annual maintenance runs less than $500 for all years in this range except for 2016 which comes in at $558. Per owner survey results, repairs running past $500 have an 8% chance of being related to the brakes.
The most common DTCs for 2016 to 2019 Camrys are P0456 for a gas cap and P0301 for the fuel pump. Typically, a loose gas cap will run you from $0 to $150, but keep in mind this particular issue can often be resolved by simply tightening the cap.
On the other hand, a bad fuel pump (common cause of P0301 for 2018 Toyota Camry) may cost as much as $617 to replace. See if you can get the pump covered under the recall at your local Toyota dealership before paying for it out of pocket. 2016 and 2017 Camrys have three listed recalls with only a few thousand cars affected; however, the fuel pump recall from 2020 carries over into 2019 and 2018 too and repair should be covered for those years.
2012-2015 Toyota Camry
- FIXD Reliability Score: 5-7/10
- Owner Reliability Score: 7-9/10
- KBB Value: $7,773 – $10,641
- Fuel Economy: 26-27 mpg
- Annual Maintenance/Repair: $500-$829
- Safety Rating: 4.6/5
As you hit the 10-year-old mark on Camrys in this 2012-2015 range, you’ll find average mileage creeping over 100,000. The good news here is that engine reliability remains steady per the FIXD data and goes up from 7/10 to 9/10 per the owner surveys.
Annual repair costs stepped past $500 on several model years with 2014 coming in at $829, but it still averages under two days in the shop. Not bad for a car going on 10 years old with 100,000 miles.The chance of a $500+ repair is high with 12.5% of 2013 owners reporting it would be due to the engine. Looking through the DTC data, it turns out the catalytic converter (DTC P0420) is a notably expensive fix, costing between $1500 and $2000.
Another DTC common to all four of these model year Camrys is P1604 that also shows up across the entire Toyota range. It can be caused by something as simple as using low quality fuel or require a replacement battery, which can cost several hundred dollars.
Fuel economy improves from 2012 into 2015 with hybrid variants steady at 40 mpg. Safety is also a high point on these models, sitting at 4.6/5 throughout the 4-year stretch. Some 30% of owners report an easy-to-use entertainment system, but as with most Camry owner survey results, cabin storage space seems lacking.
Recalls are few on these model-year Camrys aside from 2012 and 2013. Both of these years had an issue, affecting about 800,000 cars, with a clogged air-conditioning drain leading to an airbag short circuit. On the whole however, these Camrys are an ideal used car as they generally cost under $10,000 and rank well across the board.
2008-2009 Toyota Camry
- FIXD Reliability Score: 3-4/10
- Owner Reliability Score: 7/10
- KBB Value: $5,367-$5,750
- Fuel Economy: 23-24 mpg
- Annual Maintenance/Repair: $614-$875
- Safety Rating: 4.8/5
Though the FIXD reliability score for 2008 and 2009 Toyota Camrys sounds low at 3-4/10, these are actually rated at a 7/10 by owners. This indicates that the severity of the check engine lights may be relatively low for most people. The most severe, common repair we saw show up was a catalytic converter replacement due to DTC P0420. If you are shopping for a 2008 – 2009 Camry, do yourself a favor and check to see if the converter was replaced recently, if it was, congrats, you just saved yourself $2000. If not, try to get some money knocked off the purchase price and budget to replace the converter within the next couple of years.
Both the 2008 and 2009 Camry also experienced issues with a broken door control receiver. Indicated by DTC B1242, this can cause issues with the key fob and door locking functionality. It is one of the most common Toyota CELs and can run as much as $450 to fix.
These years are also relatively light on the wallet when it comes to purchasing, probably because they generally have 150,000 miles on them according to our surveys.
Fortunately, 29% of owners feel the 2008 Camry will run past 200,000 miles – and they should know as nearly 60% report using the Camry for “lots of driving”.
NHTSA safety scores are near the top for both years, although gas mileage is not overly impressive, the hybrid Camry from this period is rated at 34 mpg.
These Camrys are from the years when Toyota recalled over 4 million vehicles to address the issue of pedal entrapment and incompatible floor mats. Considering this happened 15 years ago, the recall work should already be done, but of course it is important to verify this before making a purchase.
The Worst Years of the Toyota Camry
The Toyota Camry has a well-earned reputation for durability, but as with any car, it is not without its faults. Gleaned from engine reliability reports, owner surveys, and crash test results, we’ve categorized those faults into the Camry model years to avoid. Information on DTCs, recalls, and maintenance costs are included in this analysis as well.
2001-2002 Toyota Camry
- FIXD Reliability Score: 1/10
- Owner Reliability Score: 5-6/10
- KBB Value: $2,194-$3,032
- Fuel Economy: 22 mpg
- Annual Maintenance/Repair: $563-$609
- Safety Rating: 4/5
When a car is more than 20 years old with mileage in the neighborhood of 185,000, it’s likely going to have problems. Such is the case with these turn-of-the-millennium Camrys, compounded by 2002 being the first year of the fifth generation that brought an all-new 2.4L inline-4 motor. As is commonly the case, engine reliability fell going into 2002 by a full point according to owner survey responses and FIXD reliability is at an all-time low.
It’s not all doom and gloom as you can get yourself into these early Camrys for under $3,000 while feeling comfortable with the strong safety score. And annual maintenance, given the age and mileage averages, is not outrageous, which aligns with some 20% of owners reporting these Camrys are cheap to repair.
As this was the pre-hybrid Camry era, owners can only expect 22 mpg on average and one of the most common CELs is for DTC P0420 – the catalytic converter – which costs up to $2,000 (you should ask if it was replaced to help negotiate a price if you are buying one of these years).
Though it won’t hit your wallet as hard as a catalytic converter, DTC P0446 could still run as much as $1,000 to repair. Caused by an issue with the evaporative emission control system – that prevents fuel vapors from escaping into the atmosphere – this issue is low on the severity scale, but can cause other problems if not addressed.
Fortunately, recalls are few here, but some of the 2002 models have a side-curtain airbag recall affecting around 130,000 cars.
2006-2007 Toyota Camry
- FIXD Reliability Score: 2-4/10
- Owner Reliability Score: 8/10
- KBB Value: $4,159-$4,772
- Fuel Economy: 23 mpg
- Annual Maintenance/Repair: $656-$896
- Safety Rating: 4.2-4.8/5
It’s not a pretty picture for the 2006 and 2007 Camry. Annual repair costs on the 2006 model year are around $900. Costs for the 2007 (year one of the sixth generation) come out to about $900/year too.
Known for excessive engine oil consumption, the 2007 Camry took a dive on the FIXD reliability score from 4 to 2, one of the lowest on the spectrum.
Additionally, these model years show around 165,000 miles on the clock and only 18% of owners expect that number to cross 200,000. Of repairs that cost over $500, 30% are repairs done to the engine.
Some of that maintenance is lower cost like DTC P0171 for a mass airflow sensor that runs between $200 and $300. However, expensive catalytic converter replacements are another problem area for these model years and can cost $2000+. P0446 is another common DTC. It indicates the need for a new charcoal canister which can cost between $750 and $1000.
Although Kelley Blue Book values these Camrys under $5,000, and that is tempting, the 2008 and 2009 model years – which make our list of best Camrys – typically cost only a few hundred dollars more and will probably save you money on repairs in the long run. Point being, avoid the 2006 and 2007 Toyota Camry.
2010-2011 Toyota Camry
- FIXD Reliability Score: 4-5/10
- Owner Reliability Score: 7-8/10
- KBB Value: $5,726-$5,797
- Fuel Economy: 25-26 mpg
- Annual Maintenance/Repair: $542-$588
- Safety Rating: 3.4-4.8/5
These 6th-gen Camrys appear at a glance to be worth considering with relatively low annual repair costs and owner reliability scores between 7 and 8/10. However, the FIXD data tells a different story on engine performance.
It was in 2010 that Toyota replaced the base 2.4L inline-4 with a new 2.5 liter engine and that seems to have caused a drop in reliability. This is likely to be what caused the decreased market value for these model years. To put salt on the wound, 31% of owners don’t think their 2010 Camry will make it past 200,000 miles and 41% of the 2011 model year owners say the same.
The 2011 Camry also performed quite poorly in crash testing. But, why? In 2011, the NHTSA began a new, more rigorous crash testing protocol. Clearly, Toyota was not ready with the Camry as the overall score dropped from 4.8 to 3.4, an average driven by scores of just 2 out of 5 in the front passenger side and rear passenger test. For comparison, the Honda Accord scored an overall average of 4.4 in 2011.
A bright point here is that 14% of owners noted they used the 2010 Camry for “luxurious driving”, a marked jump over prior years. That coincides with a mid-cycle refresh that brought upgraded audio options, Bluetooth across the board, and auto up/down windows.
DTC C1201 is the most likely issue owners of these model year Camrys have experienced. It’s common across the Toyota lineup and in the case of the Camry is related to an oxygen sensor issue. Replacement runs under $300 for DIYers or up to $500 for a mechanic to do the work.
Though not as prevalent, DTC P0171 does show up with some regularity on these sixth-generation Camrys. Caused by an air-fuel mixture ratio that is out of balance, this should be addressed quickly to avoid internal engine damage. Our explainer video goes into detail on this problem.
There are nine recalls associated with the 2010 Camry that mostly affect small numbers of vehicles. However, the pedal entrapment issue noted in the 2008-2009 Camry section above does carry over into 2010, so be sure to verify that fix has been completed before you buy.
2003-2005 Toyota Camry
- FIXD Reliability Score: 2-4/10
- Owner Reliability Score: 6-8/10
- KBB Value: $3,452-$3,721
- Fuel Economy: 22-23 mpg
- Annual Maintenance/Repair: $530-$1,036
- Safety Rating: 3.8-4.2/5
The “best” of the worst Toyota Camry model years, these 2003-2005 cars have engine reliability scores that go up and come back down per owner surveys. Those numbers put these Camrys on the fence, but the multiple years of $1,000 annual repair bills push them to the wrong side.
One aspect of this bump in service cost is DTC P0301, a code for the variable camshaft timing solenoid that will set you back between $1,000 and $1,500. That correlates with the 25% of 2003 Camry owners who think these Camrys are expensive to fix.
Another big ticket repair common to the 2003, 2004, and 2005 Camry is DTC P0420 for the catalytic converter. Whether you do it yourself or pay a mechanic, replacing the catalytic converter will cost you more than $1,500.
The NHTSA overall safety score slipped below four between 2003 and 2004 along with fuel economy that averages 22 to 23 mpg – though in fairness the Camry didn’t average 25 mpg until 2010. Additionally, there is a recall for a faulty crankshaft pulley affecting about 420,000 2004 and 2005 Camrys, another factor bringing these model years into the “worst” category.
FAQs
What years of the Toyota Camry have engine and/or transmission problems?
For the most part, the Toyota Camry has delivered reliable engines and transmissions over the past 20 years.
Exceptions include the 2006 Camry as data indicates 30% of $500+ repairs are engine repairs, though the transmission shows a 0% likelihood here. Both 2001 and 2003 Camrys show a 75% chance of a $500+ repair each year. 25% of owners said it was their engine while 10% – 12% said it was their transmission.
What is considered high mileage for a Toyota Camry?
Given the fact that over 20 years, Camry owners have an average of 143,000 miles with older cars running towards 190,000, the 200,000-mile mark could be considered high for the Camry.
The 2001 through 2005 model years all make our list of worst Camrys for various reasons, but they also average 175,000 miles. As well, on the question of whether the Camry will run past 200,000 miles, 20% of 2001 owners say no, a figure that jumps to 32% for 2005 owners.
That being said, an older Camry with 200,000 miles of highway driving and regular maintenance is likely better qualified to keep going than a newer model with half the miles that were accrued around town with a poor service history. So, make sure to do your homework before buying any Camry to get a full picture of what those miles truly add up to.
Do any hybrid years have problems?
If you’re considering a hybrid Camry, look at 2012 or newer and skip the earlier models. Introduced in 2007, the initial hybrid models were not all bad, but they landed in the midst of a Camry series with overall poor reliability.
In 2012, the 7th-generation Camry debuted, and with it came a revised hybrid system that pushed the average fuel economy figure from 34 to 40 mpg. That metric jumped again in 2018 with the most recent Camry generation, to 49 mpg., making these later hybrids ideal candidates for what most buyers are likely interested in – fuel efficiency.
What other vehicles should I consider?
Toyota makes it easy to stay in the family for those looking at something besides a Camry. The four-door Corolla has been on sale even longer than the Camry and continues to offer a smaller footprint and lower price point. Though it was discontinued in 2022, the Avalon dates to 1995 and remains a nice option for those in need of more cabin space but who want to stay in a sedan.
These days, finding any sedan is becoming increasingly difficult, but the Honda Accord (or Civic), Nissan Altima, and Hyundai Sonata all continue to deliver competitive alternatives to the Camry. Of course, the sky’s the limit on SUVs, but The Toyota Highlander, Honda CR- V, Ford Edge, and Chevrolet Equinox deliver similar mid-sized footprints to the Camry in a taller riding package.
What owners of the Toyota Camry like to use their car for:
| Frequent Use Categories: | How Useful? (Out of 5 Stars) |
| Family Vehicle | ***** |
| Lots of Driving (travel/long commute) | **** |
| Hauling/Towing | * |
| Office on Wheels | * |
| Sport/Fast Driving | * |
| Luxurious Driving | * |
| Outdoor/Off-Road | * |
A Note About Data and Information Sources
This article has many details about Toyota Camry reliability; here’s what we used for our assumptions and recommendations.
- FIXD Reliability Score & Data: Engine reliability information is captured via the FIXD App.
The FIXD Reliability Score is calculated using the number of DTCs per year, weighted by mileage. This is then turned into a scale of 1-10 for easy graphing.
This is an objective score.
- Owner Reliability Score & Data: This data is the result of surveying Toyota Camry owners who use FIXD.
The Owner Reliability Score comes straight from owners of the Toyota Camry.
This is a subjective score.
To determine the Owner Reliability Score we ask each car owner:
How reliable would you say your Toyota Camry is?
a. Just point A to point B driving
b. A Daily Commuter
c. Good for a 100 mile road trip
d. Good for a 500 mile road trip
e. I could take a cross-country road trip, no problem
From here we translate their answers into the Owner Reliability Score:
a. = 2
b. = 4
c. = 6
d. = 8
e. = 10
Keep in mind, owners may think their car is more or less reliable than it actually is.
One potential problem is that people often buy the same make or model they are used to when they go car shopping, just a newer year.
Ford, for instance, has a number of consumer loyalty awards for the Ford F-Series, Ford Mustang, and Ford Expedition.
Car owners may be so loyal to the make or model they currently own that they would have trouble accurately comparing their cars’ reliability to others.
It’s for this reason that the Owner Reliability Score. We intentionally ask car owners a question that is relative to mileage rather than relative to other cars.
Still, be mindful of the accuracy of these Owner Reliability Scores, people’s perceptions and unconscious blindspots can skew data.
We suggest looking at both the FIXD Reliability Score and the Owner Reliability Score for this reason.
- KBB Value: Average private-seller valuations as supplied by Kelley Blue Book (KBB), based on a {make} {model} with typical mileage for that respective model year.
- Fuel Economy: Mileage-per-gallon estimates according to the EPA MPG on Fueleconomy.gov
- Annual Maintenance/Repair: Upkeep expenses as reported by surveyed Ford Toyota Camry owners
- Safety Rating: Crash test data collected and reported by NHTSA. We average all ratings for each year to come up with a simplified, average safety score. This makes it easier to look at on a graph.

Niel Stender grew up doing replacement work on his old Cherokee and sweet Mitsubishi Starion, which led to a degree in mechanical engineering and a job at Ford as a vehicle dynamics engineer. His writing infuses that automotive background with sales and marketing experience. Writing about cars for close to a decade now, he enjoys digging into some of the more technical mechanical systems under the hood and throughout a vehicle.