
| Income Bracket | Monthly Financing Cost Range | Cash Purchase Price Range | Ford Ranger Years | Toyota Tacoma Years | Best Model Year: | Why? |
| < $5k | $42 – $83 | $1,500 – $3,000 | N/A | N/A | N/A | Neither truck fits this price bracket |
| $5k – $10k | $83 – $125 | $3,000 – $4,500 | 2003 | N/A | 2003 Ranger | There are no used Tacomas at this price point |
| $10k – $15k | $125 – $187 | $4,500 – $6,750 | N/A | 2002 | 2002 Tacoma | Only “worst of” Rangers in this price range |
| $15k – $25k | $187 – $312 | $6,750 – $11,250 | 2008, 2010, 2011 | 2011 | 2011 Tacoma | Higher reliability score |
| $25k – $35k | $312 – $437 | $11,250 – $15,750 | N/A | 2012, 2013, 2014 | 2014 Tacoma | No Rangers available at this price point |
| $35k – $50k | $437 – $625 | $15,750 – $22,500 | N/A | 2015, 2017, 2018, 2020 | 2020 Tacoma | 10/10 for objective reliability |
| $50k – $74k | $625 – $925 | $22,500 – $33,300 | 2019, 2020, 2021 | 2019, 2021 | 2021 Tacoma | Identical reliability score but the Tacoma is safer |
See the methodology for the table above.
As the midsize pickup truck segment continues to heat up, new truck prices are higher than ever. So, it’s a good time to look back on the used market for those who need the utility of a pickup, but not the footprint of a full-size model. In particular, we’ll be comparing the Ford Ranger and Toyota Tacoma going back to 2001.
Both trucks have been around for decades, though Ford stopped selling the Ranger stateside between 2012 and 2018, which is reflected in the charts throughout this comparison. As of 2019, it has returned to rest-of-world configuration with an all-new model coming for 2024.
Over at Toyota, the Tacoma enjoys a cult-like following as evidenced by 2023 sales of more than 234,000. Ford sold just over 32,000 that year. Like all Toyotas, the Tacoma is renowned for reliability and resale values, which we’ll discuss below.
This comparison leans on our best and worst model year rankings of the Ford Ranger and Toyota Tacoma. Focused on objective reliability as calculated by FIXD devices installed in thousands of owner’s vehicles, these rankings also factor in subjective reliability according to those owners.
Additionally, we consider current market values per Kelley Blue Book (KBB), safety ratings published by the National Highway Traffic Safety Administration (NHTSA), fuel efficiency figures according to FuelEconomy.gov, and annual maintenance costs recorded by owner survey responses.
It’s a whole lot of data, which is why we’ve distilled it into the table above. Here, you’ll find rows broken out by income range, financing costs, and average prices. Then, we suggest model years for each truck that has already earned a “best of” nod from our model year rankings series. Finally, an overall winner is chosen with a brief explanation of the reasoning.
The goal is to provide a starting point in your used Ford Ranger vs. Toyota Tacoma buying journey. You can also take a look at our used car buying checklist for more insight. If you want to get an idea of how other trucks stack up, check out our best and worst model year series for the Chevy Colorado, Nissan Frontier, Ford F-150, and Toyota Tundra.
Price History Comparison | Ford Ranger vs. Toyota Tacoma
Average Market Value – Based on Owners’ Self-Reported Mileages | Ford Ranger vs. Toyota Tacoma
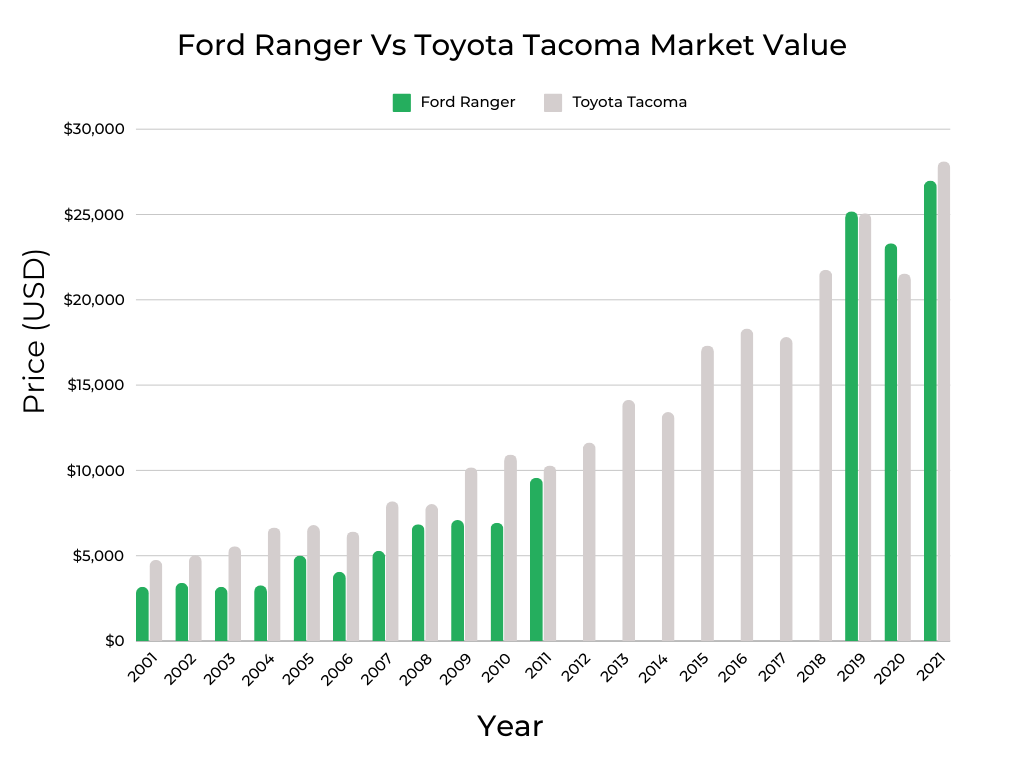
The chart above compares current market values from KBB for the Ford Ranger and Toyota Tacoma between 2001 and 2021. As mentioned above, there is no data for the Ranger between 2012 and 2018 as it was not on sale during this stretch. This is reflected in the sections below as well.
Tacomas have a reputation for strong resale values and that is evident on this chart where the gray bars (Tacoma) exceed the green bars (Ranger) for the first 10 years. Reliability definitely plays a role in this as we’ll cover below, but the Toyota also has a far shallower rate of depreciation, which will also be discussed shortly.
As of 2019, when the Ranger returned to North America however, Ford figured out reliability for their midsize truck and market values responded accordingly. But the main point of this graph is to give you an idea of how far your budget will go on a used Ranger or Tacoma.
Depreciation vs Maintenance Expenses
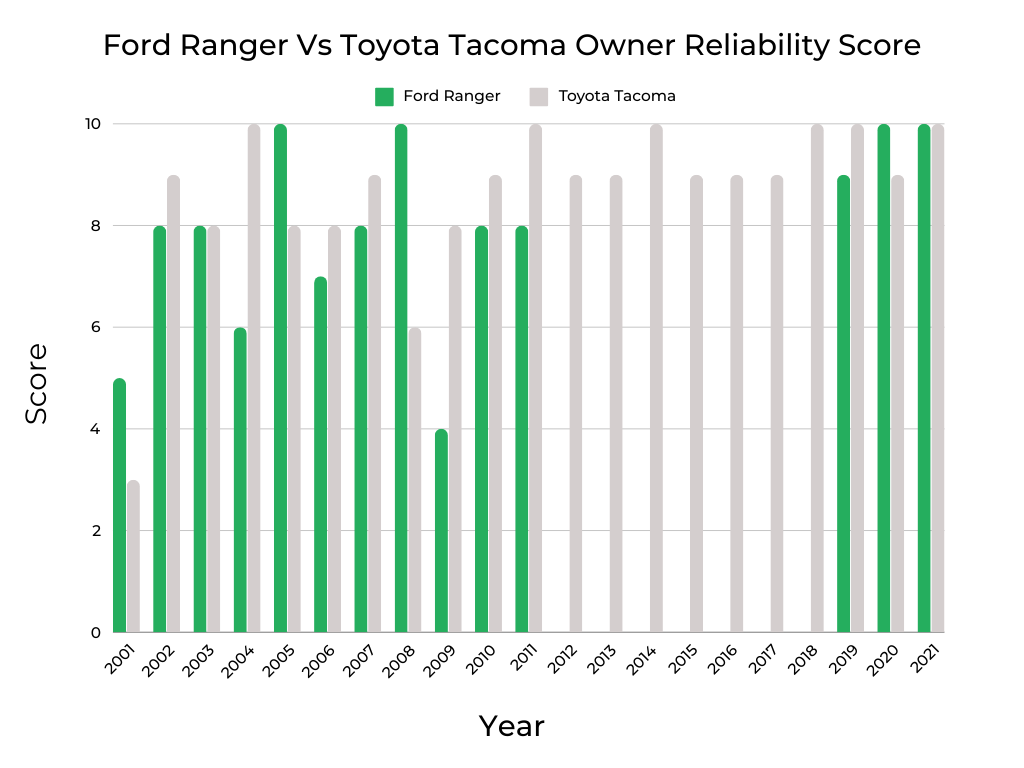
A theme that carries throughout this comparison of the used Ranger and Tacoma is that the Toyota generally dominates the Ford in all metrics between 2001 and 2011. But when the new Ford Ranger arrived in 2019, it competed on a more even footing with the Tacoma.
This is reflected on the FIXD Reliability Score chart above on the left. As you can see, the Tacoma (gray bars) was out in front of the Ranger (green bars) for this objective measure of reliability nearly the entire time. But from 20190-2021, these scores were the same.
That being said, the 2001 and 2008 Tacoma get a thumbs down on the model year rankings, even though they enjoy huge reliability score advantages over those model year Rangers. The chart on the right shows us how reliable owners think their trucks are.
Even though the Toyota Tacoma scores higher most of the time in the first half of the chart, the gap with the Ranger is smaller here. This is a good reminder to do more than simply rely on friends’ and neighbors’ recommendations when it comes to buying a used vehicle.
Longevity Comparison | Ford Ranger vs. Toyota Tacoma
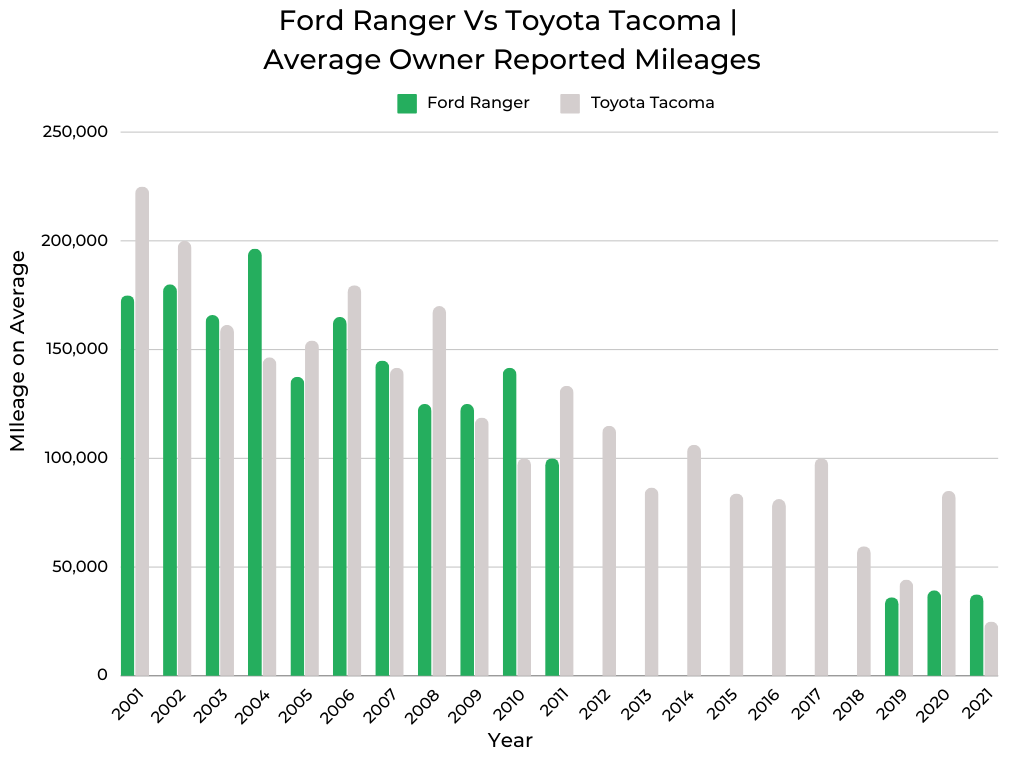
Regardless of whether you go with a used Ford Ranger or Toyota Tacoma, you shouldn’t be intimidated by odometers with readings of 100,000 miles and higher. As you can see on the chart above, which is based on owner-reported mileage, these two trucks are no strangers to longevity.
But, you may be more comfortable with 150,000 miles than the next person, so you can use this chart as a guide for what to expect when shopping.
Whether or not you consider 150,000 miles to be high mileage, it’s worth noting that more than 30% of Ranger owners and nearly 25% of Tacoma owners report using their trucks primarily for “lots of driving”, so don’t be shocked when the odometer reflects this.
Who Should Buy These Cars: The Legacy of The Ford Ranger & Toyota Tacoma
| Frequent Use Categories: | Ford Ranger | How Useful? (Out of 5 Stars) | Toyota Tacoma | How Useful? (Out of 5 Stars) |
| Family Vehicle | * * * | * * * |
| Lots of Driving (travel/long commute) | * * * * | * * * |
| Hauling/Towing | * * * | * * * |
| Office on Wheels | * | * * |
| Sport/Fast Driving | * | * |
| Luxurious Driving | * | * |
| Outdoor/Off-Road | * * | * |
As noted earlier, “Lots of driving” is one of the most frequently cited ways that owners use their Ford Ranger and Toyota Tacoma. Per the table above, hauling and towing are also popular activities for owners. This is not surprising, they are trucks after all, but it does highlight the importance of talking to the previous owner about the details around this.
That’s because pulling a trailer on mountain roads regularly, for example, puts a fair amount of strain on a vehicle, so you want to know how the truck was cared for. The same is true of off-roading, which Ranger owners cite more frequently. So, be sure to do your homework before committing to a purchase.
One other frequent-use category that both trucks have 3 stars for is “Family Vehicle”. This normally goes hand-in-hand with solid safety ratings. However, as we’ll look at below, the Ranger doesn’t meet that expectation as strongly as the Tacoma.
Driver Experience | A Summary of The Top 10 Ford Ranger vs. Toyota Tacoma Reddit Posts:
To add another layer of insight to this used Ford Ranger vs Toyota Tacoma comparison, we have consulted the What Car Should I Buy Reddit. In here you will find all manner of opinions from owners and the peanut gallery on which truck is best.
Common themes within this forum are that the Tacoma is going to be more expensive due to Toyota’s ability to maintain resale value. So, most argue against buying a used model as you won’t save all that much money over a new one.
Although Tacomas are often cited as more reliable than the Ranger, most agree that used Rangers, from the last generation, with the 4.0L V6 powertrain can hold their own in this conversation. The latest generation Ranger, which arrived in 2019, is also well-liked for its fuel-efficient combination of an EcoBoost engine and a 10-speed automatic.
Anytime you ask for opinions on trucks, you’re guaranteed to elicit strong opinions from loyal fans. So, take the usual Ford or Toyota “sucks” refrain with a grain of salt. As one Redditor explained, since these are trucks, sometimes it’s better to put a bigger priority on how the truck was used by the previous owner over any statistics.
Year-by-Year Comparison | Ford Ranger vs. Toyota Tacoma
Best & Worst Years | Ford Ranger vs. Toyota Tacoma | 2001-2024
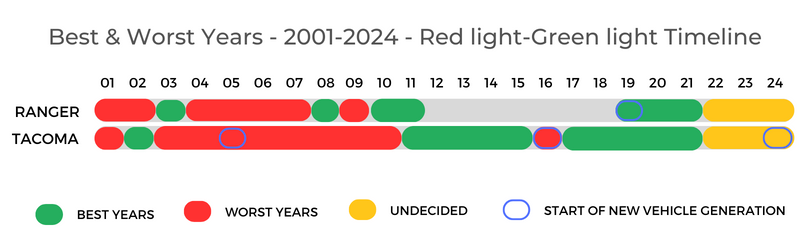
We’ve discussed the best and worst model year rankings of the Ford Ranger and Toyota Tacoma. With the graphic above, you can get a quick summary of these two articles. Model years in the green have received a “best of” rating versus those in the red that are considered “worst of”.
The yellow bands cover model years that we do not have enough data to make an accurate call, while blue-circled model years indicate the beginning of a new generation. This is an occasion often accompanied by poor reliability as the automaker works through production gremlins. As you can see, the 2005 and 2016 Tacoma follow this trend.
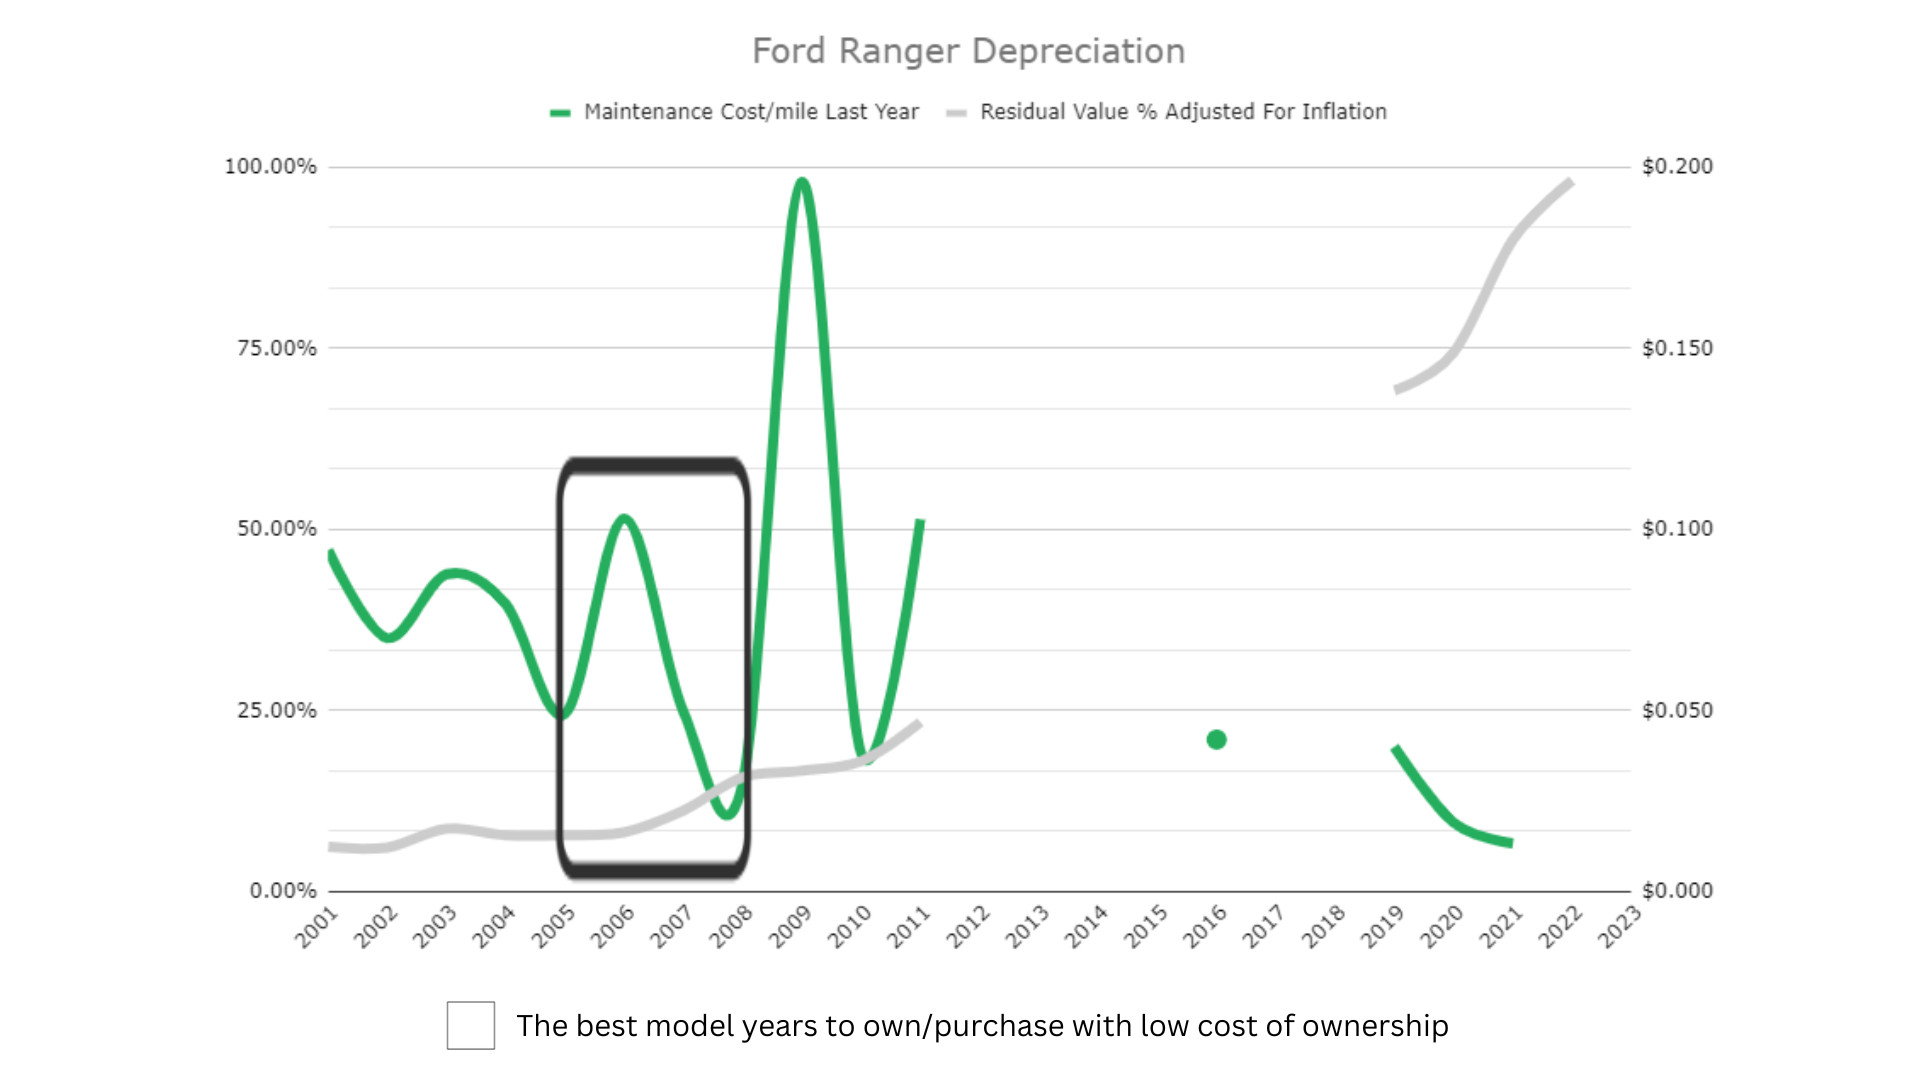
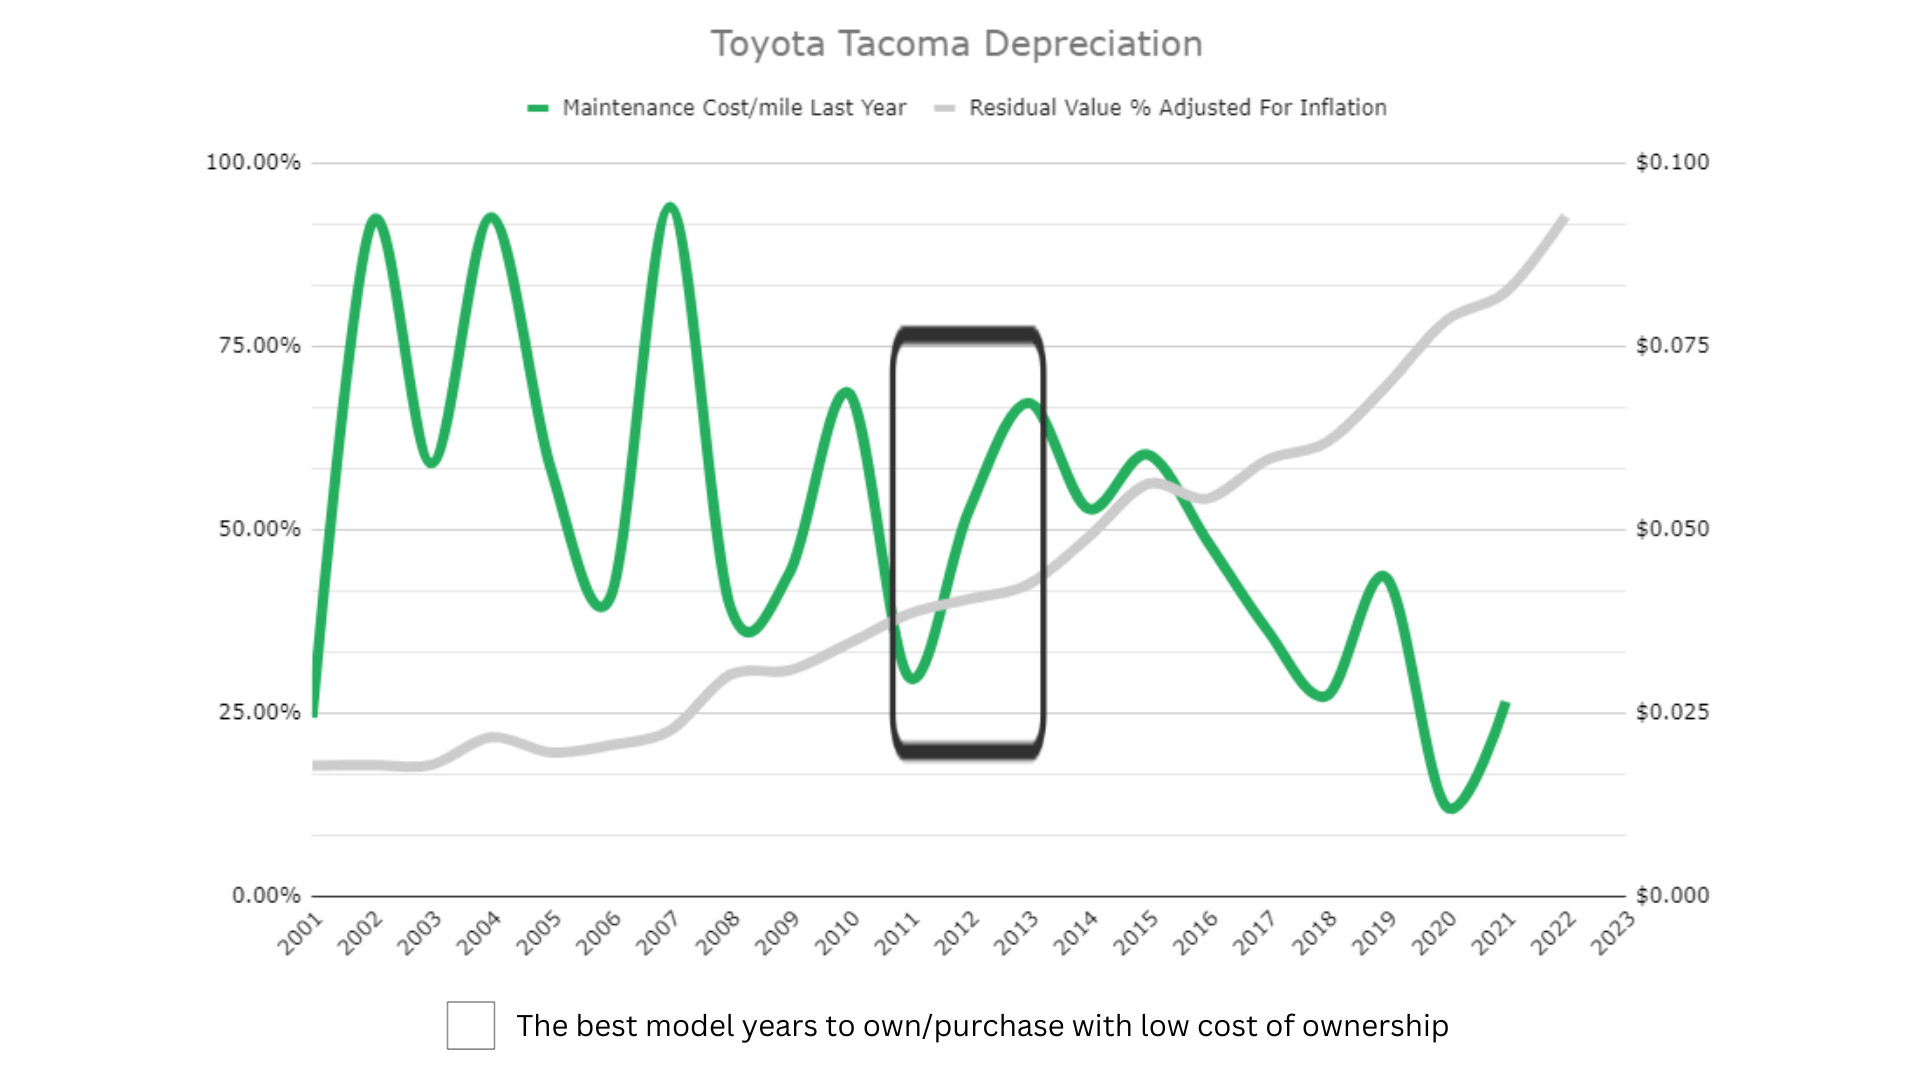
Taking this graphic and the earlier depreciation charts into consideration, we can see that the 2008 Ranger is a “best of” model year and in the “sweet spot” for depreciation and upkeep. For the Toyota, this criteria is true of the 2011-2013 model years.
Important Features Timeline | Ford Ranger vs. Toyota Tacoma
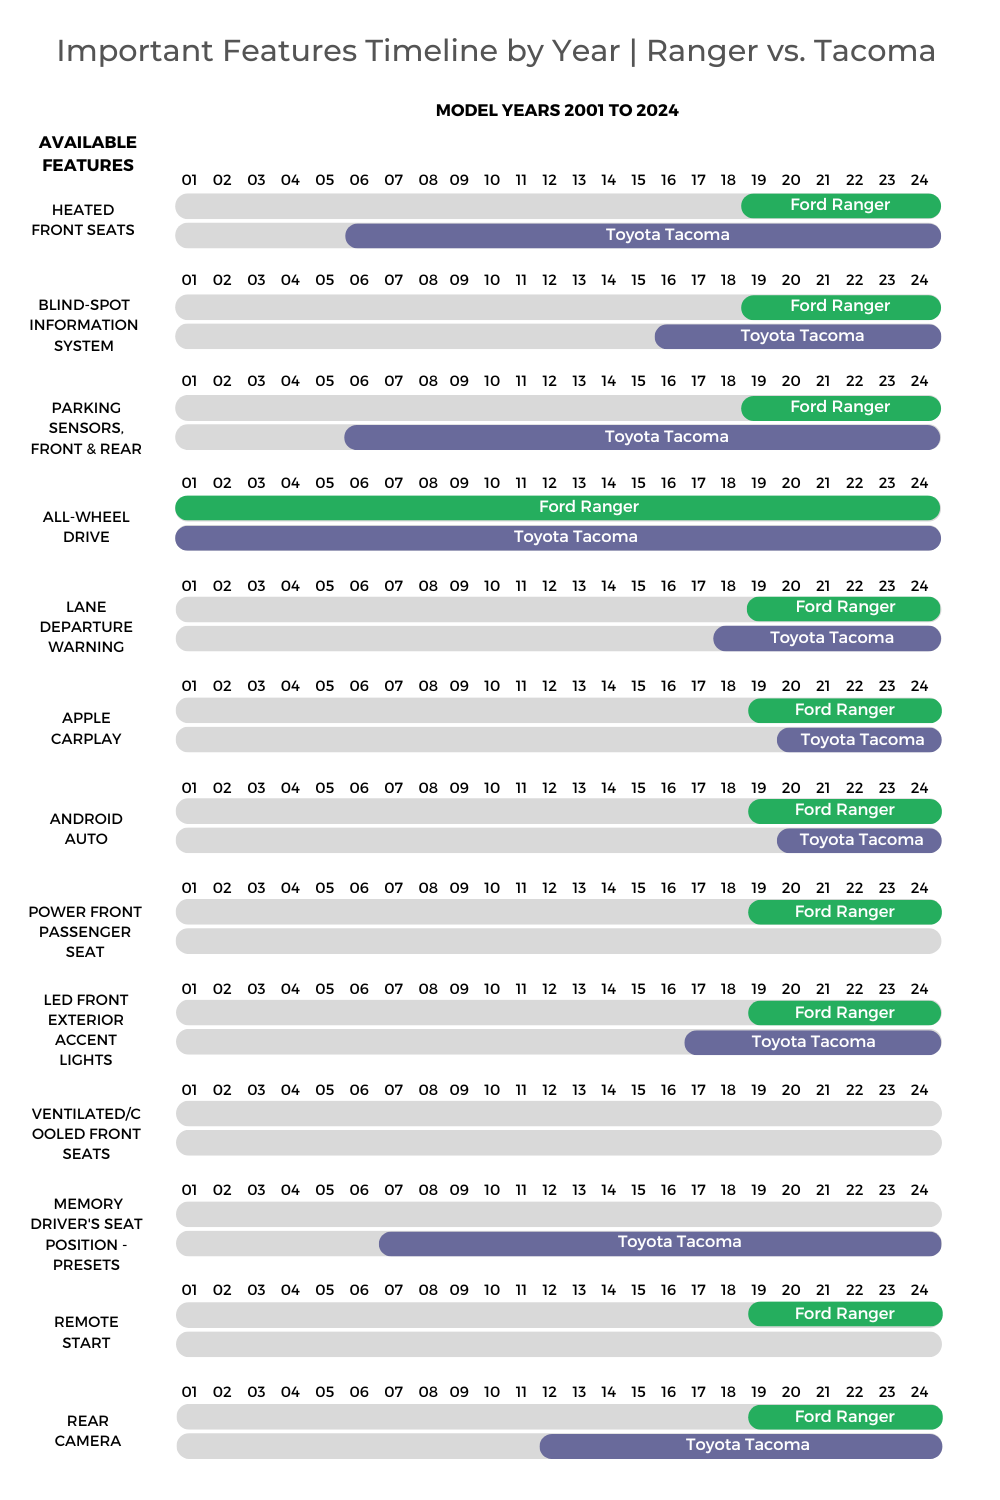
Reliability is important, but when you’re shopping for a used vehicle, sometimes you just want to know if it has heated seats. The above graphic aims to help with this by illustrating when popular features were first available on the Ford Ranger and Toyota Tacoma.
Those heated seats, by the way, have been offered on the Toyota since 2006, but only since 2019 on the Ford. Neither has ever been sold with ventilated front seats, but Apple and Android integration showed up on the Ranger in 2019 and the Tacoma a year later.
Both Ford and Toyota offer a robust roster of advanced safety aids on their new trucks, but blind-spot monitoring has been available in the Tacoma since 2016 and the Ranger since 2019. Lane departure warning also arrived in 2019 for the Ford and one year earlier for the Toyota.
As traditional pickup trucks, the Ranger and Tacoma have always been RWD with the option for 4WD. As for a manual transmission, the Toyota has offered one from 2001 through today versus the Ford that last offered a stick on the 2011 model year truck.
Maintenance Costs (Year-by-Year Average) | Ford Ranger vs. Toyota Tacoma
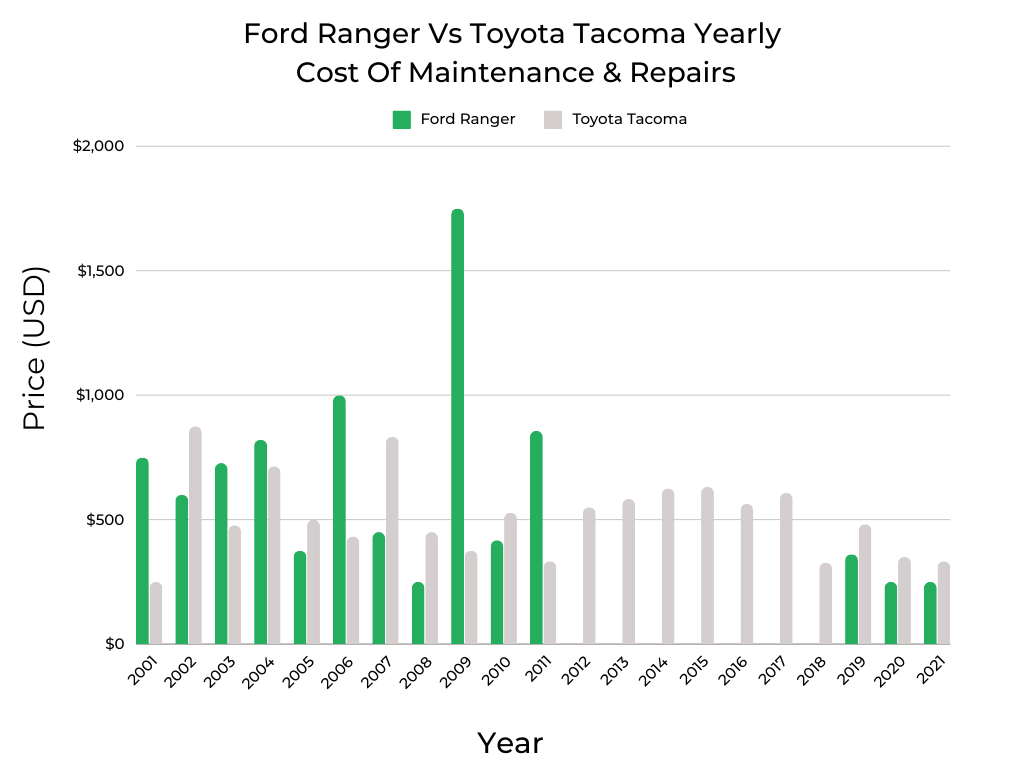
Just like with reliability, the Toyota Tacoma fares better when it comes to annual upkeep costs between 2001 and 2011. The overall annual maintenance cost average for the Ford Ranger is $684 according to owners. For the Tacoma, that figure comes in significantly lower at $515.
You can see this in action on the chart above where the green bars (Ford) are generally higher than the gray bars (Toyota) during these early years. The Ranger also has the dubious distinction of being the only truck to crack the $1,000 and $1,500 mark. Little surprise the 2006 and 2009 model years, which hit those milestones, get a thumbs down on the model year rankings.
By 2019, the Ranger had gotten its maintenance act together, coming in lower for this metric versus the Tacoma every year since. However, be aware that high service costs don’t automatically translate to an unreliable truck. An owner that was meticulous about maintenance will naturally rack up more bills than someone who runs their vehicle into the ground.
Safety Rating Comparison | Ford Ranger vs. Toyota Tacoma
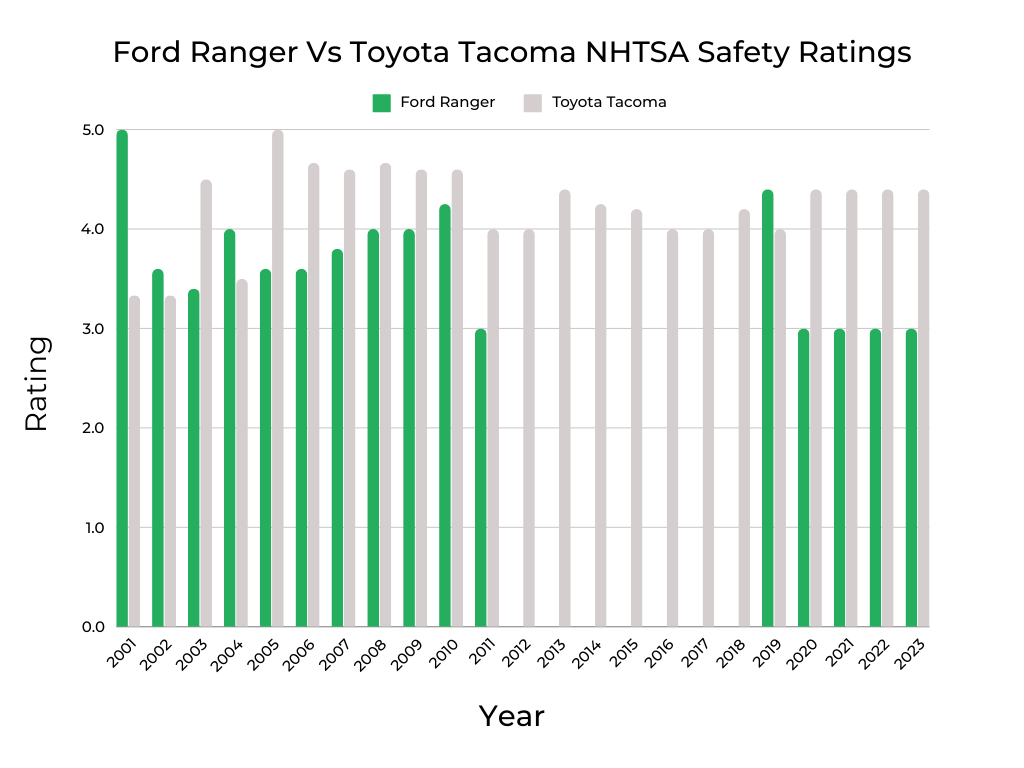
As mentioned earlier, the Ford Ranger doesn’t fare well against the Toyota Tacoma when it comes to safety ratings. This is reflected in the above chart, which illustrates the average NHTSA safety scores of these two trucks. During the 16 years that both pickups have been for sale, the Tacoma has a higher safety rating 11 times and the Ranger rarely cracks the 4-star mark.
In 2011, the NHTSA started running a new stricter test protocol that drove a nearly universal industry-wide decline in safety ratings.
While both trucks saw a decline that year, the Ranger’s was more pronounced. As for the relatively low Ranger scores since 2020, the NHTSA has only tested these trucks for rollover, so we expect these metrics to improve once the front and side tests are completed.
Fuel Efficiency Comparison | Ford Ranger vs. Toyota Tacoma
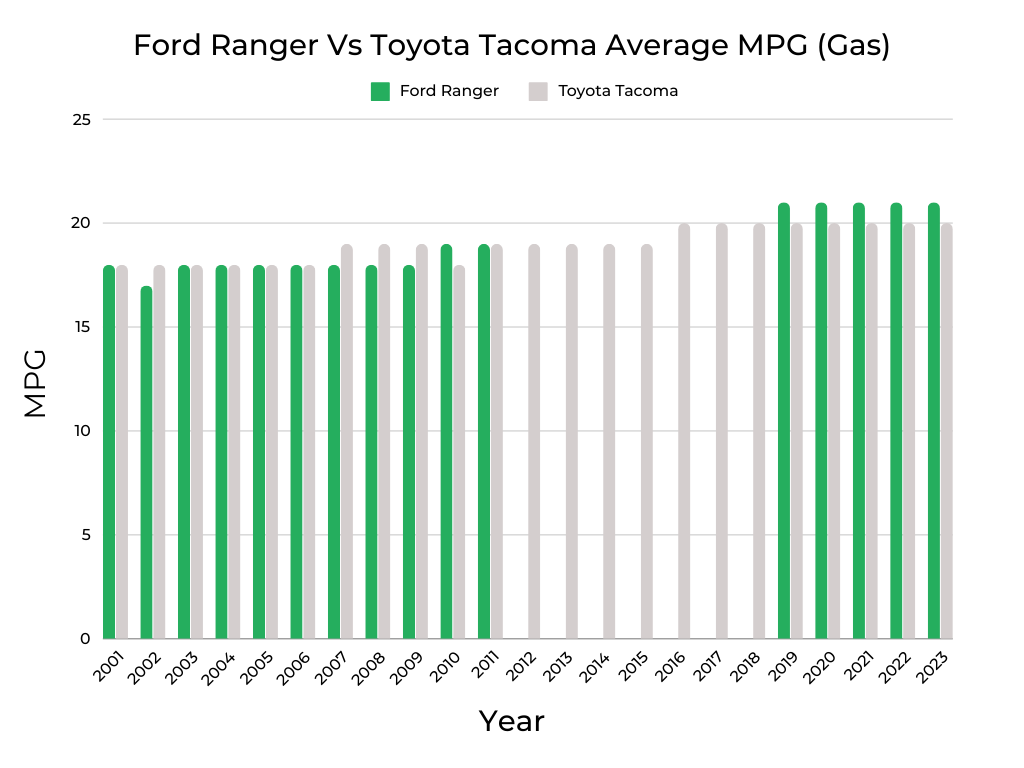
One area these midsize pickup trucks line up very closely is fuel economy as evidenced by the above chart showing average ratings for each model year. For the most part, the Ford Ranger and Toyota Tacoma offer almost identical fuel efficiency.
As is often the case, these trucks posted improvements in fuel economy with the start of a new generation as better technology enables thriftier consumption. You can see this happen with the 2019 Ranger – when it cracks 20 mpg for the first time – and the 2016 Tacoma.
Of all the model years we looked at, the 2008 Ranger is a good bet for Ford fans as it sits in the sweet spot of depreciation and gets a “best of” rating on the model year rankings. The 2011-2013 Tacoma meets this same criteria while offering a slightly better average fuel economy of 18 mpg.

Niel Stender grew up doing replacement work on his old Cherokee and sweet Mitsubishi Starion, which led to a degree in mechanical engineering and a job at Ford as a vehicle dynamics engineer. His writing infuses that automotive background with sales and marketing experience. Writing about cars for close to a decade now, he enjoys digging into some of the more technical mechanical systems under the hood and throughout a vehicle.


