1. Year
2. Make
3. Model
4. Trim
5. Fuel Type

Great news! FIXD is compatible with your vehicle.

BUY NOW

Unfortunately, FIXD is not guaranteed to be compatible with your vehicle.

BLACK FRIDAY DEAL

Chevrolet Traverse | Depreciation Rate & Curve Graphed

The Chevrolet Traverse, on average, loses 56.9% of its value in the first five years of ownership. Given the depreciation curve, the maintenance cost per mile, and that the Traverse didn’t debut until the 2009 model year, we’d say the ownership sweet spot for the Traverse lies within the 2009–2013 model years. If you want to get at least three years of the sweet spot, don’t buy anything older than the 2011 model year. 

2023 Chevrolet Traverse display at a dealership.
TABLE OF CONTENTS

Find the depreciation rate of your Chevrolet Traverse in the graph below.

Chevrolet Traverse Depreciation

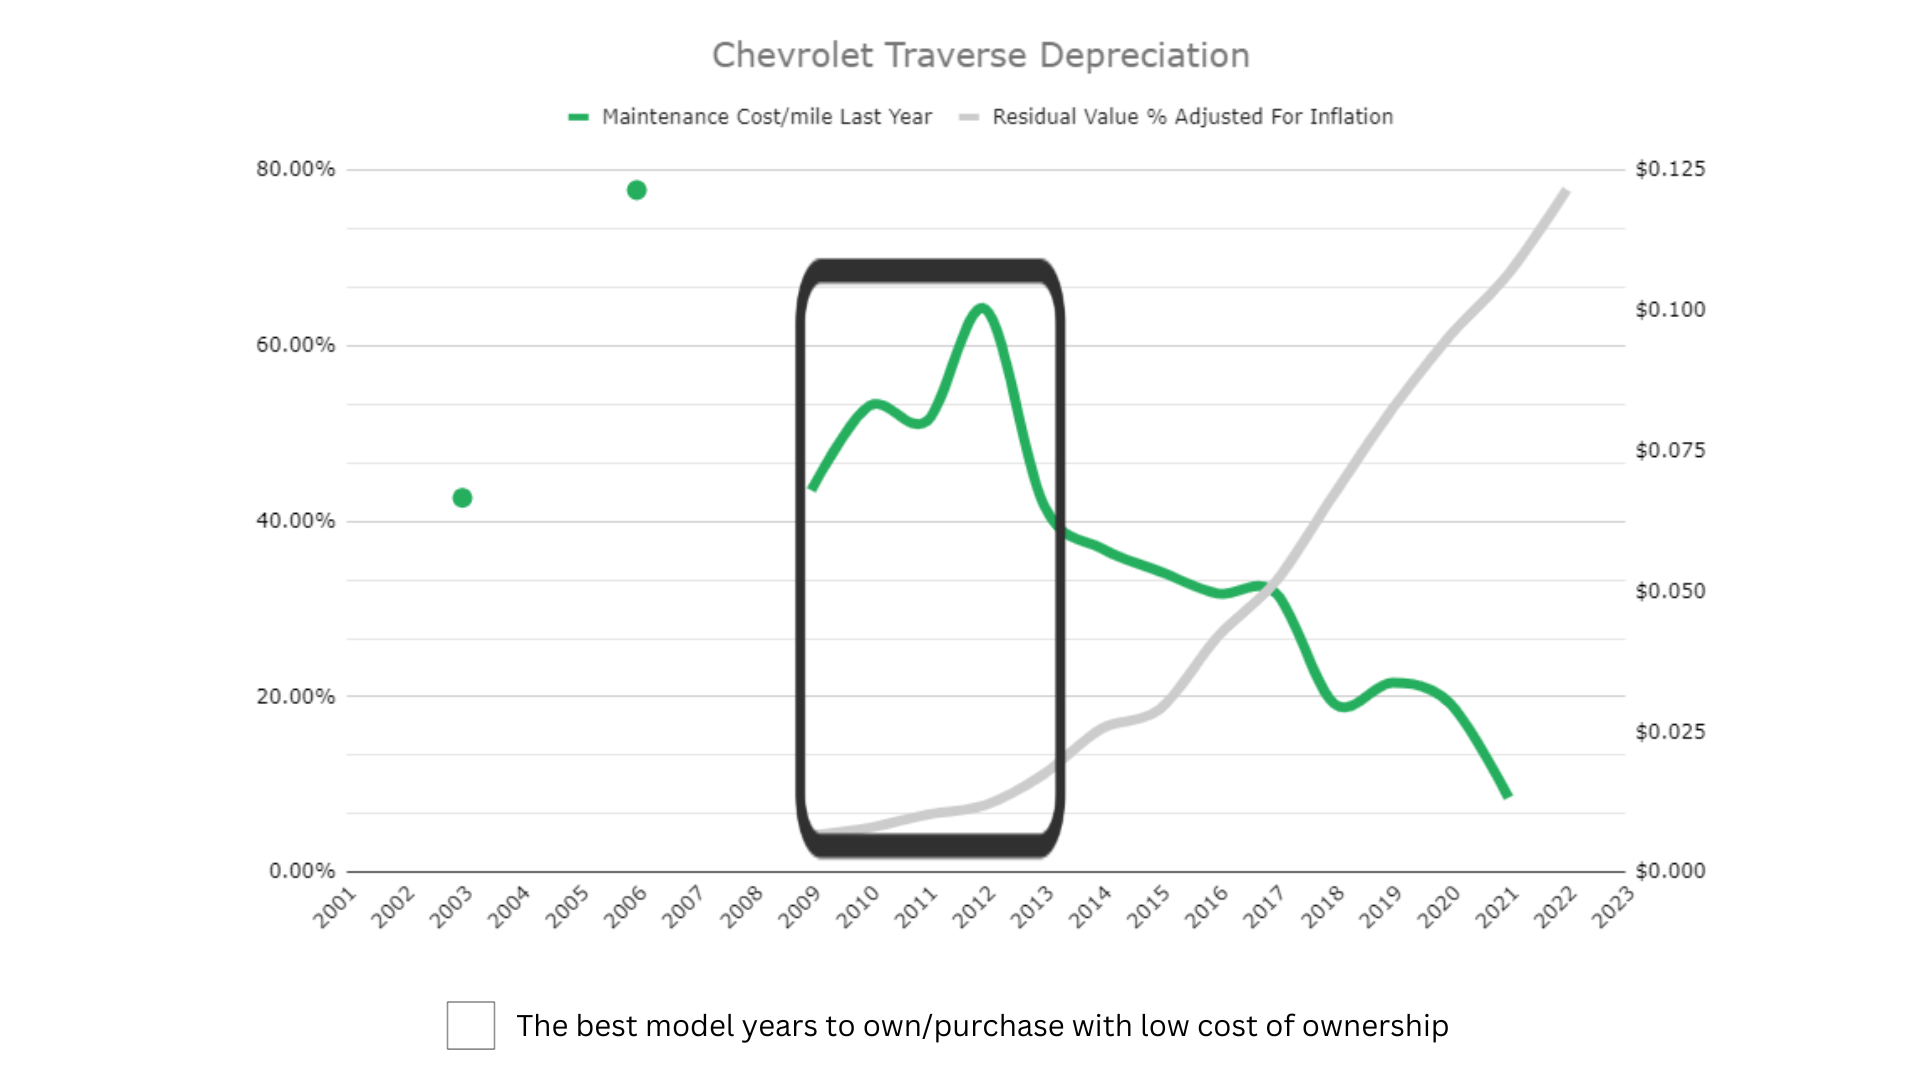
Depreciation, the process of losing value over time, happens to all vehicles, though it doesn’t affect all makes and models in the same way. By knowing the depreciation rate of a specific vehicle, you can understand its long-term value and total cost of ownership, which enables you to make informed choices about buying and selling. Typically, the steepest drop in value takes place in the first year of ownership. Afterward, it gradually normalizes. The same is true for the Chevrolet Traverse, which sees its annual depreciation rate slow after year six.

Keep in mind that just because the vehicle costs the least to own in the sweet spot we have outlined here, you still may not want to own the vehicle during these depreciation sweet spot years. Although vehicles depreciate less as they get older, they have more repairs. Duh right? However, keep in mind that repairs don’t just cost you money, they cost you time. Reliability is the difference between being able to make it to your destination on time or missing an opportunity because the car broke down.

Check out our article on the best and worst years of the Chevrolet Traverse to see our reliability ratings for all years of the Traverse between 2009-2022. We also cover MPG, safety ratings, and a number of other factors. We pulled data from Traverses registered in our app and surveyed owners to get you data-backed answers on just how good or bad each year of the Traverse is.

If you want to know the depreciation and maintenance costs for your particular vehicle, use our free “Total Cost of Ownership” tool available in the FIXD App – Android or IOS.

If you like our online tools and articles consider purchasing our FIXD sensor for $19.99 (this is 67% OFF). It’s our flagship product. With it, you scan your car for common engine problems.

If our sensor detects any problems with the engine, our app will clearly explain:

  1. What could have caused it and
  2. How much the possible repairs may cost.


If you’d like, we’ll even show you trusted repair shops in your area where you can get your ride fixed through RepairPal. The total cost of ownership feature within the app totals your maintenance costs, repairs, and depreciation (Sensor + App). This is free on the app.

Chevrolet Traverse Depreciation

Model YearsMileageAmount DepreciatedResidual Value PercentageResale Value
2001264,000 N/AN/AN/A
2002252,000 N/AN/AN/A
2003240,000 N/AN/AN/A
2004228,000 N/AN/AN/A
2005216,000 N/AN/AN/A
2006204,000 N/AN/AN/A
2007192,000 N/AN/AN/A
2008180,000 N/AN/AN/A
2009168,000 $35,553.524.2%$1,547
2010156,000 $35,772.535.1%$1,938
2011144,000 $34,260.846.6%$2,419
2012132,000 $33,796.877.7%$2,824
2013120,000 $32,916.8511.2%$4,145
2014108,000 $31,355.2616.4%$6,136
201596,000 $30,536.1518.6%$6,978
201684,000 $27,574.2926.9%$10,137
201772,000 $25,334.0933.2%$12,586
201860,000 $22,902.2643.1%$17,325
201948,000 $18,769.1752.8%$21,011
202036,000 $ 15,946.0961.2%$25,190
202124,000 $12,339.2568.2%$26,522
202212,000 $8,023.6877.8%$28,113
20230 N/AN/AN/A

The above chart outlines the approximate depreciation for a Chevrolet Traverse from model years 2009 to 2022. The numbers, based on Kelley Blue Book data dating back to the vehicle’s debut, assume a Traverse in standard trim, a generic color such as black or white, and a mileage of 12,000 per year.

Keep in mind that the auto market was heavily affected in 2020 and beyond. Automakers selling new cars during the COVID pandemic raised prices which caused a spike in demand in the used car market as people tried to save money. Many automakers, however, did not drop prices after the pandemic, they kept them so they could make a larger profit.

This is why the most recent years of many vehicles have seemingly experienced less depreciation. Some, such as 2010, may have even appreciated due to the heightened levels of inflation created.

Factors That Impact the Chevrolet Traverse Depreciation Rate

Depreciation or depreciation of the car over time. Wooden car and hourglass on blue background.

Chevrolet was once one of the premier names in the automotive industry, but its reputation has faced some challenges since the 1980s. Today, Consumer Reports describes the American automaker as one of the “less reliable brands”, though there are some vehicles in its lineup that are above average. Given that, the long-term value of a Chevrolet vehicle will depend, in part, on the good name of the model in question.

The Traverse happens to have a decent name. Consider, for example, the 2023 model year, which has earned solidly “Great” ratings in reliability, driving experience, and resale value from J.D. Power. In theory, that should help the vehicle retain good value for longer.

Brand reputation isn’t the only thing that can slow or accelerate value loss. The variables discussed below can also impact the depreciation rate of a vehicle:

A vehicle’s model year determines its age. This designation denotes a particular version of a model more so than the date of its release. It’s not uncommon for automakers to release a vehicle to the market in the year or two preceding its assigned model year. The 2023 Traverse, for example, went on sale in the fall of 2022.

Broadly speaking, older model years are less valuable than newer ones, and the most current model year is the most valuable of them all. The reason is that automakers update their models with every new release. One year, a vehicle might include certain design touches and features that the outgoing model didn’t have, which elevates the value of the former and devalues the latter.

Value changes can affect brand-new vehicles, too. Say that you buy a 2023 Traverse today, only for Chevy to release the 2024 model in two weeks. Though your vehicle is still new, it will drop in value because the latest version is now available.

Body type is a category that refers to a vehicle’s size and shape. On the smaller end of the spectrum are passenger cars such as sedans, coupes, hatchbacks, and station wagons, which all have lower profiles but feature different physical arrangements and designs. Larger body styles include minivans, sport utility vehicles, and pickup trucks, which are both more spacious and more space-consuming than passenger cars.

The Chevrolet Traverse is an SUV, which is currently the most popular body style in the North American market by a wide margin. According to the Alliance for Automotive Innovation, SUVs have more than 55% of the market share of new purchases by U.S. buyers, which is more than double the share of the second-leading segment. If you own a Chevy Traverse, that means you have a vehicle with a body type that’s generally more desirable to consumers, suggesting higher-than-normal value retention in the long run.

Mileage shows how much use a vehicle has seen, which in turn indicates the amount of wear and tear one can expect it to have. Many people assume that a high number on the odometer equals high mileage, but that isn’t always the case. To get a better sense of whether a vehicle has high or low mileage, we recommend comparing the odometer against the vehicle’s age to calculate the yearly average.

Imagine, for example, you have a 2010 Traverse with 130,000 miles on it. As the vehicle is 13 years old, that means it has an average yearly mileage of 10,000. The average yearly mileage for American drivers is 12,000, which means you could describe this Traverse as a low-mileage vehicle. As a result, it’s more likely to hold value than a Traverse of the same year but with 200,000 miles on it.

Overall condition refers to the quality of a vehicle’s looks and functionality. A vehicle in good overall condition has normal wear and tear, such as minor cosmetic blemishes, but nothing that would significantly compromise its safety, drivability, or appeal. Keep your Chevrolet Traverse in good condition by keeping up with its maintenance schedule, as regular services such as oil changes and tire rotations help prevent mechanical issues. Also, don’t underestimate the value of safe driving. A careful and defensive approach can keep you and your vehicle out of accidents, both minor and major.

The site iSeeCars conducted a study in 2023 that revealed the impact that color has on a vehicle’s sale price. If you’re looking to maximize value preservation, consider a yellow vehicle, which would lose only 13.5% of its value in three years. On the other hand, try to avoid brown or gold vehicles, which lose 24% and 25.9% of their value, respectively, in the same time frame. More common colors — white, blue, gray, silver, and black — hover around the overall average of 22.5%.

The reasoning behind these findings is unclear, but it may be simply an issue of supply versus demand. Yellow is a generally appealing color, but one that isn’t widely represented on the road. Common colors are desirable, but their wide availability drives down their value. As for brown and gold, there just isn’t enough demand for those colors in general.

Other Costs of Chevrolet Traverse Ownership

Depreciation is just one of the costs of ownership. Consider two other major expenses to gain a better sense of a vehicle’s long-term value:

Insurance

Not all vehicles cost the same to insure. Those that have a higher initial cost, feature hard-to-replace parts, or lack sufficient safety features often yield higher insurance rates because the insurer must take on more risk to cover them. In the United States, the overall average for full-coverage auto insurance is $1,630 per year, or $136 per month. Against that, the Chevrolet Traverse may compare favorably, as it can get full-coverage rates as low as $1,444 per year, or around $120 per month. That number is just the average, though. Specific rates may vary widely depending on where you live.

Maintenance

Following the maintenance schedule for your Chevrolet Traverse is essential to keep it running in tip-top shape. If you consider every model year of the Traverse since 2009, you’ll find that the average cost of maintenance and repair is around $708 per year, which is higher than the average for all SUVs. The high maintenance costs of early model years skew this number, which could get as high as $1,063. Since 2018, the average costs have been much more reasonable, ranging from $250 to $563.

Below is a list of Traverse model years you may want to avoid if one of your goals is to keep maintenance costs at least around the overall average:

  • 2009–2016

The Best Model Year To Buy a Chevrolet Traverse

Based on factors including price and reliability (but not depreciation), our choice for the best Chevrolet Traverse model years to buy are the 2015-2021, but check out our article on the best and worst years of the Traverse to get the whole story.

Though they are outside of the ownership sweet spot, we recommend the above model years because of their reliability and low costs. Both have FIXD and owner reliability ratings from seven to nine (out of 10), and the 2019–2021 model years have annual maintenance costs as low as $250 per year. They also offer terrific safety features, with the 2015–2019 model years earning a 4.8 (out of five) overall safety rating from the National Highway Traffic Safety Administration.

Buying a Chevrolet Traverse New vs. Used

20-Year Projection Table

20-Year Projection
Years Since PurchasedDepreciated ValueWith Inflation
1$26,857$29,648
2$23,543$27,511
3$21,126$24,816
4$18,227$21,490
5$14,878$17,458
6$11,461$13,415
7$9,286$10,885
8$6,421$7,571
9$5,661$6,698
10$3,866$4,623
11$2,658$3,231
12$2,278$2,847
13$1,761$2,239
14$1,450$1,863
15$2,254$2,853
16$1,854$2,324
17$1,139$1,425
18$1,001$1,260
19$1,025$1,283
20$922$1,136

Buying a brand-new 2023 Chevrolet Traverse will run you at least $34,520. If you drive it for 12,000 miles per year, it will have an estimated resale value of $21,126 in three years. That’s an accumulated depreciation of $13,394. In comparison, a used 2021 Traverse has a current value of $26,522, which represents an accumulated depreciation of $12,339.25 from an inflation-adjusted original manufacturer’s suggested retail price.

We recommend using online resources to conduct thorough research into used vehicles. Kelley Blue Book, for example, has a valuation tool that can give you estimates of appropriate resale value. Other than that, make sure to consider the other costs of ownership when you’re finalizing the decision to purchase a vehicle and refer to our checklist for buying used vehicles so you don’t overlook any important considerations.

Methodology

The data provided in this article relates to the base-level trim of the Chevrolet Traverse for every model year since its debut in 2009. Using the base-level trim as our reference point helps to standardize the findings, as higher trims usually include materials and features that increase the initial value of the vehicle and help it retain value over time.

Keep in mind, there are large economic factors at play here too and the sale of new cars has caused shifts in the used market too. There is a stark difference in the cost of vehicles due to car manufacturers seeking higher profit margins after COVID as detailed by CNN and posted by CBS channel 58:

“… (T)he auto industry saw sky-high profits even as sales plummeted. Domestic manufacturers of cars and car parts saw a profit of $32 billion through the third quarter of 2022 (the latest data available) — their largest profit since 2016. Car dealerships also reported record-breaking profits through Q3, according to auto-retail advisers Haig Partners.

That’s because pandemic-era pent-up consumer demand remained strong as supply shifted, allowing automakers to increase their prices and their profit margins. Cars and trucks were sold nearly as soon as they hit dealership lots, and the average price paid for a vehicle in December soared to a near-record high of $46,382, according to J.D. Power.

Data from the Labor Department’s November Consumer Price Index shows American consumers are paying about 20% more for cars than they were in 2019.

The trend could continue into next year — research website Edmunds expects new-car sales to hit 14.8 million in 2023, a marginal increase from last year but well below pre-pandemic levels.

The auto industry has entered a new era: Less choice, higher prices and larger profit margins. So far it seems to be working for them.”

This shift by car companies to create higher profit margins by taking advantage of the heavily-reported-on chip shortage panic of COVID has had rebounding effects upon the value of used cars.

Be aware that newer years (the latest 3-4 model years) may be inflated in price because of this and depending on how big this problem is for the model you are considering – it may even be inflating the price of the older model years.

Frequently Asked Questions About Vehicle Depreciation

The Chevrolet Traverse seems to lose value at around the average overall rate. It depreciates by 22.2% in the first year of ownership, and in three years, it retains 61.2% of its original value.

Remember, though, that several variables can determine the final resale value of any vehicle. Aside from age, mileage, condition, and color, you’ll want to think about where and how you sell your Traverse down the line. Say that you have a silver 2017 Traverse LS in good condition with 72,000 miles and standard options. In Eugene, Oregon, that might get you $9,600–$11,791 in a dealer trade-in and $11,453–$14,112 in a private sale. But in Newark, New Jersey, the same vehicle would get $8,995–$11,186 and $10,718–$13,377, respectively.

After weighing depreciation against the other costs of ownership, we’d say the best years for the Chevrolet Traverse are 2009 and 2010. Though later model years are more reliable and less costly to maintain, 2009 and 2010 fall within the ownership sweet spot, and their maintenance costs aren’t as high as some model years.

As for years to avoid, look below:

  • 2011–2014

Our surveys show Traverse owners have 100,000–175,000 miles accumulated on their odometers, though most are closer to the former than the latter. With that in mind, we would say that high mileage for a Traverse is 125,000 miles or above.

A 10-to-14-year-old Chevrolet Traverse should allow you to avoid most of the depreciation. That corresponds with model years 2009–2013.

References

(2023.) Chevrolet. Consumer Reports. Retrieved August 31, 2023, from https://www.consumerreports.org/cars/chevrolet

(2023.) 2023 Chevrolet Traverse. J.D. Power. Retrieved August 31, 2023, from https://www.jdpower.com/cars/2023/chevrolet/traverse

(2023.) Economic Insights. Alliance for Automotive Innovation. Retrieved August 31, 2023, from https://www.autosinnovate.org/resources/insights

(2023.) The Best and Worst Car Colors for Resale Value. iSeeCars. Retrieved August 31, 2023, from https://www.iseecars.com/car-color-study

FIXD Research Team

At FIXD, our mission is to make car ownership as simple, easy, and affordable as possible. Our research team utilizes the latest automotive data and insights to create tools and resources that help drivers get peace of mind and save money over the life of their car.

We’re here to help you simplify car care and save, so this post may contain affiliate links to help you do just that. If you click on a link and take action, we may earn a commission. However, the analysis and opinions expressed are our own.

Topics

About the Author

FIXD Research Team

FIXD Research Team

At FIXD, our mission is to make car ownership as simple, easy, and affordable as possible. Our research team utilizes the latest automotive data and insights to create tools and resources that help drivers get peace of mind and save money over the life of their car.

You might also like

Explore Car Resources

car insurance icons

Car Insurance

Find the best insurance deals for your car

Car Buying

Everything you need to know about buying a vehicle

FIXD Team logo

Car Care

Car repair costs, how-to guides, and more

car buying icons

Vehicle Search

Search any make/model for reviews, parts and more