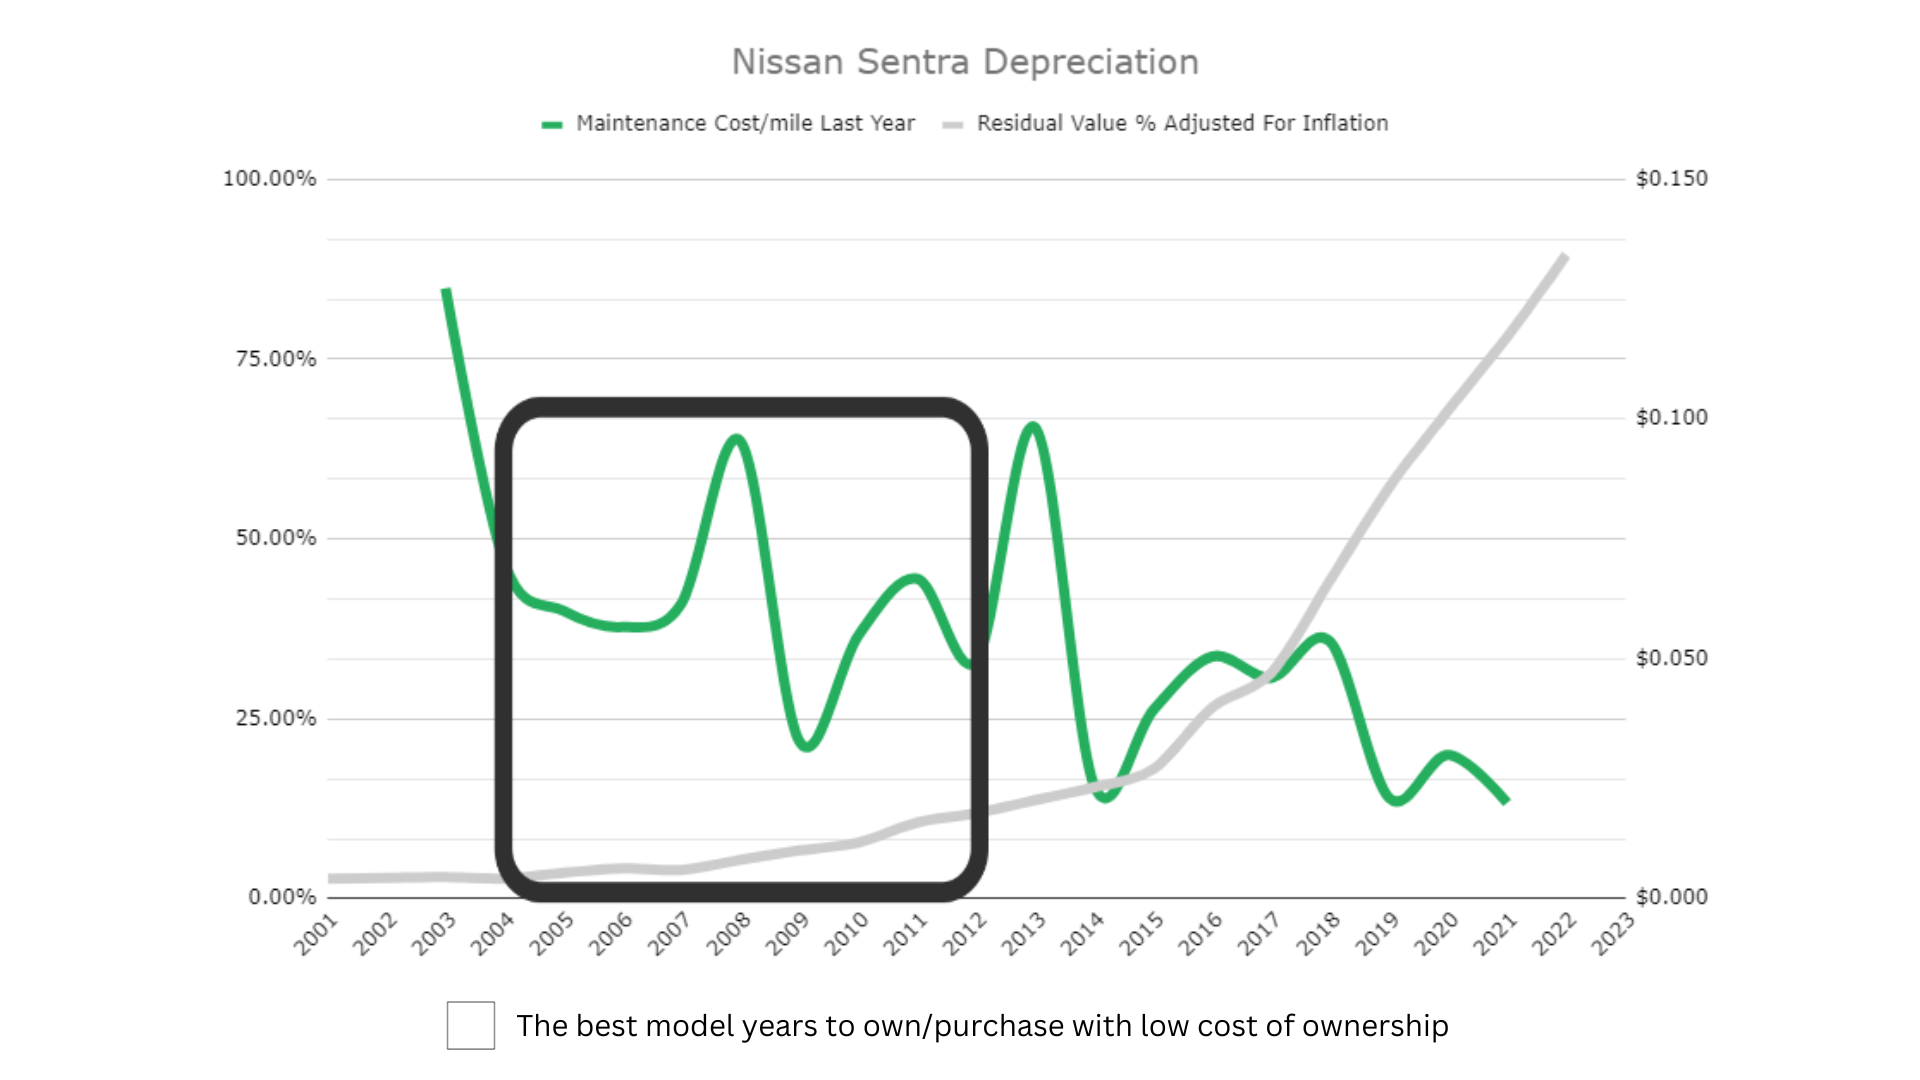
Find the depreciation rate of your Nissan Sentra in the graph below.
Depreciation is the process of losing value over time, which affects all vehicles. By understanding how depreciation works, and the expected depreciation rate for a specific make and model, you can more accurately estimate your vehicle’s long-term value and total cost of ownership.
The depreciation rate is usually the most dramatic in the first year of ownership. It tends to slow gradually afterward and then normalize to a steady annual decrease after year five. The Sentra, however, seems to follow a different pattern by starting at a relatively low pace that it maintains throughout the first five years.
Just because the vehicle costs the least to own in the sweet spot we have outlined here, you still may not want to own the vehicle during these depreciation sweet spot years. Although vehicles depreciate less as they get older, they have more repairs, and repairs cost you money and time. Reliability is the difference between being able to make it to your destination on time and missing an opportunity because your car broke down.
Check out our article on the best and worst years of the Nissan Sentra to see our reliability ratings for all years of the Sentra between 2001 and 2022. We also cover mpg, safety ratings, and several other factors. We extracted data on Sentras registered in our app and surveyed owners to get you data-backed answers on just how good or bad each year of the Sentra was.
If you want to know the depreciation and maintenance costs for your particular vehicle, use our free “Total Cost of Ownership” tool available in the FIXD App – Android or IOS.
If you like our online tools and articles, consider purchasing our FIXD sensor for $19.99 (this is 67% OFF). It’s our flagship product. With it, you scan your car for common engine problems.
If our sensor detects any problems with the engine, our app will clearly explain:
- What could have caused it and
- How much the possible repairs may cost.
We’ll even show you trusted repair shops in your area where you can get your vehicle fixed through RepairPal. The total cost of ownership feature within the app totals your maintenance costs, repairs, and depreciation (Sensor + App). This is free on the app.
Nissan Sentra Depreciation
Model Years | Mileage | Amount Depreciated | Residual Value Percentage | Resale Value |
2001 | 264,000 | $14,183.84 | 2.8% | $414 |
2002 | 252,000 | $14,576.48 | 2.9% | $432 |
2003 | 240,000 | $14,787.56 | 3.0% | $455 |
2004 | 228,000 | $15,409.63 | 2.8% | $442 |
2005 | 216,000 | $16,059.84 | 3.6% | $598 |
2006 | 204,000 | $16,365.49 | 4.2% | $720 |
2007 | 192,000 | $18,513.95 | 4.0% | $764 |
2008 | 180,000 | $19,773.04 | 5.4% | $1,128 |
2009 | 168,000 | $20,501.50 | 6.7% | $1,466 |
2010 | 156,000 | $18,339.91 | 7.8% | $1,558 |
2011 | 144,000 | $18,030.34 | 10.6% | $2,127 |
2012 | 132,000 | $17,477.10 | 11.9% | $2,352 |
2013 | 120,000 | $16,854.60 | 13.7% | $2,678 |
2014 | 108,000 | $16,455.97 | 15.5% | $3,011 |
2015 | 96,000 | $16,395.74 | 18.0% | $3,611 |
2016 | 84,000 | $14,894.65 | 26.6% | $5,384 |
2017 | 72,000 | $14,120.46 | 31.4% | $6,463 |
2018 | 60,000 | $11,510.74 | 44.3% | $9,172 |
2019 | 48,000 | $9,341.45 | 57.2% | $12,477 |
2020 | 36,000 | $7,740.38 | 67.9% | $16,408 |
2021 | 24,000 | $5,065.69 | 78.1% | $18,112 |
2022 | 12,000 | $2,229.28 | 89.5% | $18,921 |
2023 | 0 | N/A | N/A | N/A |
The chart above, based on Kelley Blue Book data since 2001, shows the approximate depreciation for a Nissan Sentra. It assumes a vehicle in standard trim, a generic color, such as black or white, and an annual mileage of 12,000.
The auto market was heavily affected in 2020 and beyond. Automakers selling new cars during the COVID-19 pandemic raised prices, which caused a spike in demand in the used car market as people tried to save money. Many automakers, however, did not drop prices after the pandemic, but maintained them so they could make a bigger profit.
This is why many vehicles in recent years have depreciated by less. Some models, such as those produced in 2019 and 2022, may even have appreciated due to the heightened levels of inflation created.
Factors That Impact the Nissan Sentra Depreciation Rate
According to Consumer Reports, Nissan as a whole has “the most inconsistent product line of the major Japanese brands.” Some vehicles in the Nissan lineup can deliver excellent performance and fuel economy, but others aren’t so efficient. Given that inconsistency, the value retention of a Nissan depends largely on the model in question. The Sentra happens to be on the “excellent” side of the divide, with the 2023 model being “one of the best sedans in its class.”
A strong model reputation certainly is advantageous for retaining long-term value, but the following factors also play important roles:
Age
To determine a vehicle’s age, we have to know its model year. A model year is a designation that describes a particular release version, not so much the year of its release. For example, the 2022 Nissan Sentra entered the market in 2021. So, if we were discussing the 2022 Sentra after the release of the 2023 model, we’d describe it as being one year old, not two.
Normally, it’s the current model year of any vehicle that holds the most value. Indeed, following the release of a new model year, the outgoing model year is likely to drop sharply in value. That’s because the newest model may have the best in technology and desirable features, and typically there’s greater market demand for the new than the old.
Body Type
Body type is a mode of classification based on a vehicle’s general shape and size. The most common body types in the U.S. market are:
- Sedans
- Coupes
- Hatchbacks
- Station wagons
- Sports cars
- Sport utility vehicles
- Minivans
- Pickup trucks
The Nissan Sentra is a sedan, which means it’s a four-door passenger car that’s divided into three easily distinguishable segments — the engine, the cabin, and the trunk. Sedans and other small passenger cars were once the dominant body type in the U.S., but they’ve been overtaken in popularity by SUVs in 46 states. Therefore, sedans tend to depreciate faster than SUVs, though there are many exceptions. The Sentra appears to be one of them.
Mileage
The number of miles driven by a vehicle indicates the extent of its use. A vehicle with higher mileage has been at work longer, suggesting that it may need more servicing than one with lower mileage. For example, some of its parts may be worn, so it has a shorter useful life before the next owner needs to fix or replace components.
The definition of “high mileage” can vary. On average, American drivers clock up 12,000 miles per year, so you could consider anything above that as high. But a vehicle like the Sentra, which owners may use for daily commutes, errands, and recreation, tends to record more miles than a pure pleasure vehicle, so it would be reasonable to allow for a few extra thousand miles per year before we enter high-mileage territory.
Overall Condition
The overall condition of a vehicle refers to its mechanical state and its interior and exterior appearance. A vehicle in good condition should have no glaring blemishes, such as dents, scratches, or torn upholstery, no mechanical issues, and no missing features regarding safety, comfort, and technical components. The key to retaining your vehicle’s value is to maintain it as close to new as you can. That involves regular maintenance and taking proactive measures to protect it, such as driving safely and keeping it sheltered when not in use.
Color
Color affects resale value because it correlates with supply and demand. Common colors, which are desirable but common, will tend to have average depreciation rates, and less common colors will occupy opposite ends of the demand spectrum depending on their general desirability.
Consider the color study conducted by iSeeCars.com in 2023. Using a three-year baseline depreciation rate of 22.5%, the study found that yellow and beige vehicles depreciated the slowest, brown and gold vehicles depreciated the fastest, and gray vehicles depreciated on a par with the average. The most value-retentive colors are generally appealing to the U.S. market but are in low supply, thus accounting for their higher value. The least value-retentive colors appeal to a much smaller segment of consumers, so there’s not enough demand for them, while gray is a generally appealing color that’s simply over-represented in the market.
Other Costs of Nissan Sentra Ownership
Depreciation is only one cost of vehicle ownership. Here are two others to consider:
Insurance
Your insurance rates depend on the type of vehicle you drive. According to our findings, the Nissan Sentra costs an average of $1,772 per year to insure, which is above the $1,652 annual average for all vehicles.
Your specific rate may depend on the model year you drive. That’s because vehicle safety plays a part in determining insurance costs, and some Sentras are safer than others. The 2022 model, for example, is a Top Safety Pick by the Insurance Institute for Highway Safety, so it may cost less to insure than, for example, the 2023 model, which performed worse in several areas.
Maintenance
Vehicle maintenance refers to routine upkeep services, preventive measures, and proactive repairs. These services keep your vehicle running optimally and resolve mechanical issues that can lead to vehicle failure. The average maintenance cost for the Nissan Sentra across all model years is low at $534 per year compared with the average cost for all vehicles of $694 per year.
Not all Sentra model years are so affordable. In our Best & Worst Years article, we provide a graph that compares the current market values and repair costs for all Sentra models from 2003 to 2021. The data suggests that you might avoid the following model years if you want to reduce maintenance costs:
- 2003
- 2013
- 2016
- 2018
Apart from these model years, maintenance costs for the Sentra are either around the national average or significantly below it.
The Best Model Year To Buy a Nissan Sentra
Based on price and reliability, but not depreciation, our choice for the best Nissan Sentra model years to buy are 2009 to 2010, 2012, 2014 to 2015, 2017, and 2019 to 2021, but read our article on the best and worst years of the Sentra to get the full story.
With the above-mentioned model years, you’re likely to enjoy the highest value because of low ownership costs, strong safety scores, and excellent reliability.
Buying a Nissan Sentra New vs. Used
20-Year Projection | ||
Years Since Purchased | Depreciated Value | With Inflation |
1 | $17,945 | $19,810 |
2 | $15,659 | $18,299 |
3 | $13,614 | $15,992 |
4 | $11,469 | $13,522 |
5 | $8,882 | $10,422 |
6 | $6,296 | $7,369 |
7 | $5,333 | $6,252 |
8 | $3,609 | $4,256 |
9 | $3,108 | $3,677 |
10 | $2,747 | $3,285 |
11 | $2,386 | $2,900 |
12 | $2,125 | $2,656 |
13 | $1,564 | $1,989 |
14 | $1,343 | $1,727 |
15 | $1,083 | $1,371 |
16 | $802 | $1,005 |
17 | $842 | $1,053 |
18 | $722 | $908 |
19 | $561 | $702 |
20 | $602 | $741 |
A new 2023 Nissan Sentra has a starting MSRP of $20,050. In three years, assuming a yearly mileage of 12,000, we estimate a value of $13,614 or $15,992, adjusted for inflation. That represents an accumulated depreciation of $6.436 or $4,058(adjusted for inflation). In comparison, a used 2020 Sentra has a current value of $16,408, down from an inflation-adjusted original MSRP of $24,148.38, which is an accumulated depreciation of $7,740.38.
To get a more accurate picture of the value of new versus old, we recommend using free resources such as Kelley Blue Book’s My Car’s Value tool. Consider also consulting our buying checklist so you know what to look for in a used vehicle.
Methodology
For the data we’ve presented in this article, we referred to the base-level trim for every Nissan Sentra from 2001 to the present. Base-level trims come with standard features, thereby removing features and other elements that could elevate the sticker price and skew our calculations for long-term value. It’s important to note that the resale value of your Nissan Sentra may be contingent on the COVID-19 era chip shortage, the condition of your vehicle, and your mode of sale.
Significant economic factors are also at play and the sale of new cars has caused shifts in the used market. There’s a stark difference in the cost of vehicles due to car manufacturers seeking higher profit margins after COVID-19, as detailed by CNN and posted by CBS channel 58:
“… (T)he auto industry saw sky-high profits even as sales plummeted. Domestic manufacturers of cars and car parts saw a profit of $32 billion through the third quarter of 2022 (the latest data available) — their largest profit since 2016. Car dealerships also reported record-breaking profits through Q3, according to auto-retail advisers Haig Partners.
That’s because pandemic-era pent-up consumer demand remained strong as supply shifted, allowing automakers to increase their prices and their profit margins. Cars and trucks sold nearly as soon as they hit dealership lots, and the average price paid for a vehicle in December soared to a near-record high of $46,382, according to J.D. Power.
Data from the Labor Department’s November Consumer Price Index shows American consumers are paying about 20% more for cars than in 2019.
The trend could continue into next year. Research website Edmunds expects new-car sales to hit 14.8 million in 2023, a marginal increase from last year but well below pre-pandemic levels.
The auto industry has entered a new era: Less choice, higher prices, and larger profit margins. So far it seems to be working for them.”
This shift by car companies to create higher profit margins by taking advantage of the chip shortage panic of COVID-19 has had rebounding effects on the value of used cars.
Be aware that newer years (the latest three to four model years) may be inflated in price because of this, and depending on how big this problem is for the model you are considering, it may even be inflating the price of the older model years.
Frequently Asked Questions About Vehicle Depreciation
Does the Nissan Sentra hold its value?
The Nissan Sentra seems to hold its value quite well. Generally, you can expect a new vehicle to lose 60% of its initial value after five years, but our data shows the Sentra losing about 55% in that period. What makes that more impressive is that the Sentra belongs to a less popular class of vehicles, sedans, but holds up better than many models in the most popular SUV segment.
If you have a Sentra, remember that its model reputation alone won’t ensure good value retention. Apart from the impacts of age, mileage, condition, and color on resale value, you should also consider two other factors — where and how you sell your car.
For example, take My Car’s Value tool to examine a silver 2018 Sentra S in good condition with 60,000 miles and standard options. If we’re in San Diego, California, we might get up to $7,584 in a dealer trade-in, but a private sale could net us $9,538. But if we were to move the sale to Blue Bell, Pennsylvania, the value would drop to $7,098 and $8,882, respectively.
What are the best years of the Nissan Sentra to buy, and which ones should you avoid?
If we consider depreciation with the other costs of ownership, then we’d say that the best years of the Nissan Sentra are the 2009 to 2010 and 2012. These model years give you solid safety ratings, good reliability, and land you in the ownership sweet spot.
As far as Sentras to avoid, we’d say that low safety scores, high numbers of diagnostic trouble codes, or high repair costs should steer you away from the following model years:
- 2001 to 2008
- 2011
- 2013
What's high mileage for a Nissan Sentra?
The definition of high mileage varies from person to person. We examine user survey data to calculate a median, and a figure above that would qualify as high mileage. On average, Nissan Sentra drivers have clocked 123,473 miles overall, and many have recorded 200,000 miles. Therefore, we’d say that anything above 150,000 miles is high mileage for a Nissan Sentra.
Which Nissan Sentra should I buy to avoid most of the depreciation?
If avoiding depreciation is your primary objective, go for a Nissan Sentra in the 11 to 19-year range. That corresponds with model years 2004 to 2012. But remember that many of those model years, 2001 to 2008 and 2011, are reputed to have problems.
References
1. (2023). Nissan. Consumer Reports. Retrieved October 13, 2023, from https://www.consumerreports.org/cars/nissan
2. (2023). Nissan Sentra. Consumer Reports. Retrieved October 13, 2023, from https://www.consumerreports.org/cars/nissan/sentra
3. (2023). Which Vehicle Type Is the Most Popular in Each State? iSeeCars.com. Retrieved October 13, 2023, from https://www.iseecars.com/popular-vehicle-type-by-state-study
4. (2023). The Best and Worst Car Colors for Resale Value. iSeeCars.com. Retrieved October 13, 2023, from https://www.iseecars.com/car-color-study
5. (2023). Car Depreciation: How Much Is Your Car Worth? Ramsey Solutions. Retrieved October 13, 2023, from https://www.ramseysolutions.com/saving/car-depreciation

At FIXD, our mission is to make car ownership as simple, easy, and affordable as possible. Our research team utilizes the latest automotive data and insights to create tools and resources that help drivers get peace of mind and save money over the life of their car.