
One player has dominated the midsize truck market for years: the Toyota Tacoma. It’s often at or near the top of buyers’ lists. However, shopping for an in-demand vehicle results in higher prices and tighter selection—factors no used car buyer wants to face. What’s a pickup shopper to do? Consider Plan B, a different truck.
Among the options is the Nissan Frontier, the truck world’s forgotten stepchild. Introduced in 1997 and updated in 2004, this capable but unremarkable pickup soldiered on basically unchanged until 2022, when Nissan finally launched an all-new Frontier.
Used truck buyers will encounter some of these latest editions, but the bulk of what’s for sale is the older type, which isn’t necessarily bad. A 2008 Frontier looks pretty much like a 2018 Frontier. Shoppers less concerned about aesthetics benefit from lower prices.
At the same time, the Tacoma is inescapable. Toyota sells about a quarter million yearly, while competitors are lucky to sell half as many (and usually much less). So, there are plenty of pre-owned Tacomas out there. Yet despite this abundance, used Tacomas are expensive thanks to solid resale values and Toyota’s reputation (deserved or not) for building reliable vehicles.
There’s also something I call the Tacoma mystique—in effect, cult-like support akin to the following attached to the Jeep Wrangler. I get it; I grew up around pickups and learned to drive on them. I have a neighbor, Tom, an amateur woodworker with a loaded Toyota Tacoma TRD Pro (the top-dog edition). He only uses his truck for commuting and picking up lumber but can’t envision driving anything but his “Taco.”
Countless people are attached to their Tacomas. While there are undoubtedly Frontier owners with similar enthusiasm, this fondness can’t be called a movement.
So, is the Tacoma worth its premium price? Only the purchaser can answer that question. Yet, in writing this comparison, I realized that the Tacoma isn’t necessarily the perfect vehicle for every truck buyer.
For one, you can usually get a comparable Frontier for less. In addition, the Tacoma’s reliability isn’t so bulletproof. FIXD sensor data reports several model years plagued by check engine lights (the Frontier has its problems, too). However, the Tacoma has lower maintenance costs, substantially better safety scores (for some years), and a stronger likelihood of a longer life.
Diving into the article will let you understand the factors necessary for making your own decision in this match-up.
Looking for the latest model? Explore: Nissan Frontier vs. Toyota Tacoma | 2023 Comparison.
Keep reading to see how this Nissan Frontier and Toyota Tacoma contest turns out. Other match-ups to review include Tacoma vs. Tundra, Outback vs. Forester, RAV4 vs. CR-V, Civic vs. Corolla, Pilot vs. Highlander, and Odyssey vs. Sienna.
| Income Bracket | Monthly Financing Cost Range | Cash Purchase Price Range | Nissan Frontier Years | Toyota Tacoma Years | Best Model Year: | Why? |
| $10k-$15k | $125-$187 | $4,500-$6,750 | 2006 | 2002 | 2006 Frontier | Good safety score |
| $15k-$25k | $187-$312 | $6,750-$11,250 | 2009 | 2006 | 2006 Tacoma | Above-average engine reliability |
| $25k-$35k | $312-$437 | $11,250-$15,750 | 2012 | 2012 | 2012 Tacoma | Average engine reliability, good safety score |
| $35k-$50k | $437-$625 | $15,750-$22,500 | 2018 | 2018 | 2018 Frontier | Excellent engine reliability |
| $50k-$74k | $625-$925 | $22,500-$33,300 | 2020 | 2020 | TIE | Exceptional engine reliability, good safety scores |
See the methodology for the table above.
Curious about other car pairings? Check these articles to explore:
Volkswagen Jetta vs. Honda Civic
Before you respond to the “For Sale” ad, check out this How to Buy a Used Car article for a step-by-step checklist.
Price History Comparison | Nissan Frontier vs. Toyota Tacoma
Average Market Value – Based on Owners’ Self-Reported Mileages | Nissan Frontier vs. Toyota Tacoma

Shopping for used trucks should include a review of a year-by-year breakdown of market prices. The graph shows Kelley Blue Book (KBB) data for private-party sales of Frontiers (green) and Tacomas (gray) from the 2001 to 2021 model years. The valuations reflect owner-reported mileage according to FIXD surveys.
Before digging into the numbers, I expected significantly higher values for the Tacoma over the Frontier. Surprisingly, this wasn’t the case. This Toyota is legendary for its low depreciation rates and holding its value better than any other midsize truck. An iSeeCars.com study reports that the Tacoma retains 86.2% of its value after five years, compared to a still-decent 72.2% for the Frontier.
Indeed, there are several years with a higher Tacoma value, but none showing the Frontier to be substantially cheaper without reason. What do I mean by “reason”? Simply, mileage greatly impacts the price of a used vehicle.
For instance, 2013 shows the Tacoma to be worth much more than the Frontier. This is due to 2013 Frontier owners reporting above-average mileage. It switches to higher-than-normal mileage for the 2014 Tacoma, accounting for a higher market value for the 2014 Frontier. This calculation also explains the plunging price for the 2020 Tacoma.
These Frontier and Tacoma valuations are primarily due to older Frontiers having higher MSRPs than the equivalent Tacomas. For example, a base 2010 Nissan Frontier sold originally for $19,300, while an entry-level 2010 Toyota Tacoma came with a $18,178 window sticker. Add lower depreciation for the Tacoma, and Frontier and Tacoma market values get closer for the respective model-year pairings.
I’ll also note that some of this leveling off is due to turbulent market conditions. In recent years, prices for used Tacomas have skyrocketed. Truck buyers looking for more affordable alternatives turned to the Frontier (along with the Ford Ranger and Chevrolet Colorado).
This increased demand caused prices to rise for second-hand Frontiers. So, these pre-owned Nissans aren’t always the bargain they used to be. Given equal factors (age, mileage, condition, and equipment), a used Frontier is likely cheaper than an equivalent Tacoma, but not substantially less.
Remember that used car prices are always higher at a dealer (sometimes, 50% more). If buying retail is a stretch to the budget, consider looking for an older truck or one with higher miles or fewer features.
Be sure to read our Best and Worst Years series of articles highlighting the Nissan Frontier and Toyota Tacoma winners and losers.
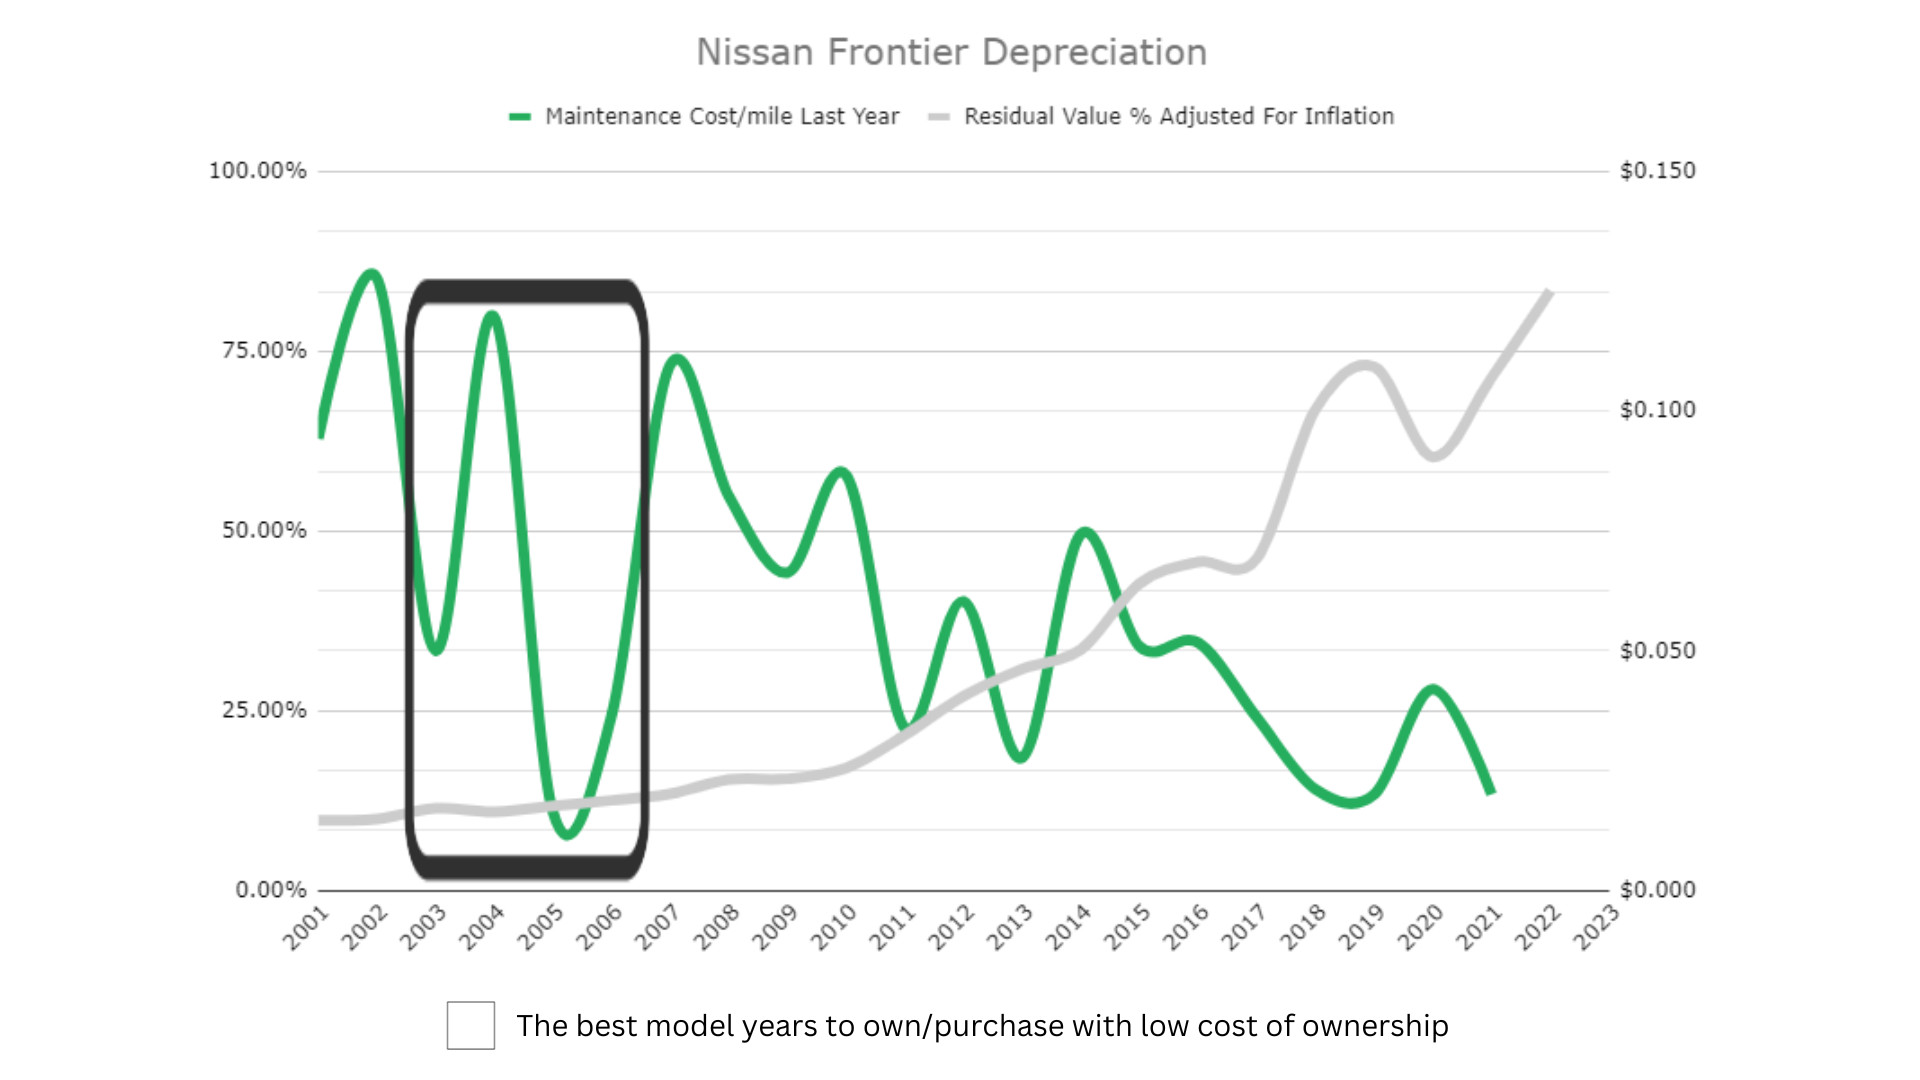
Depreciation vs. Maintenance Expenses
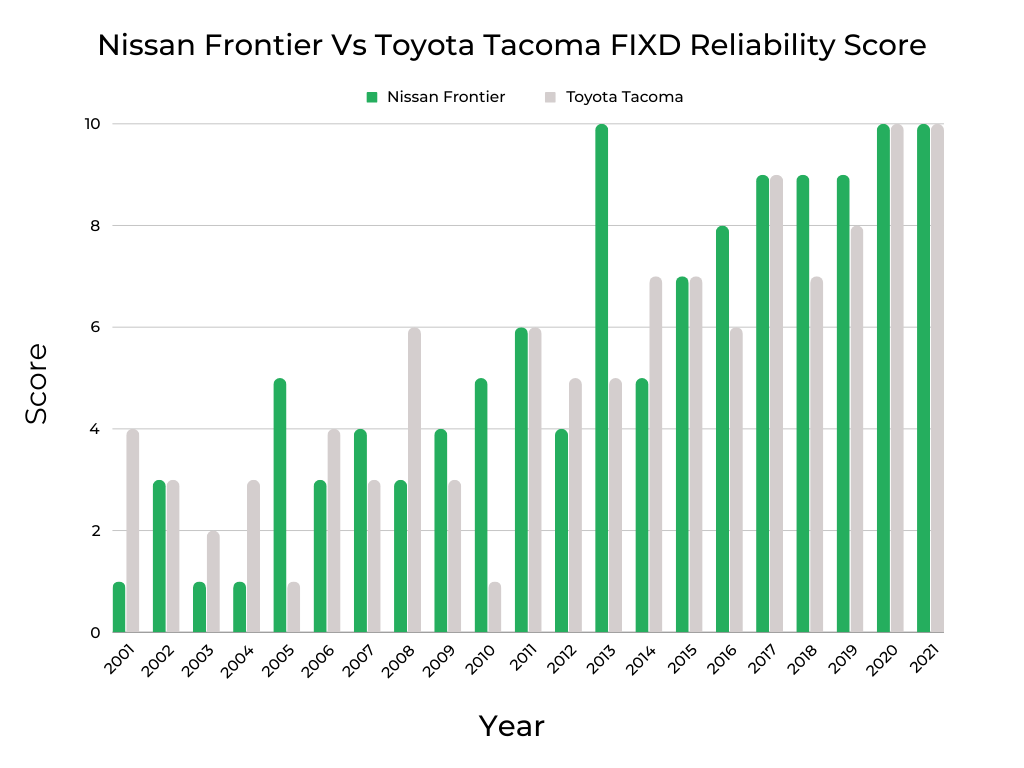
The Tacoma has a word-of-mouth reputation for solid reliability, but FIXD Reliability Scores show this isn’t the case 100% of the time. Further, don’t sell the Frontier short, as this Nissan has better overall dependability than its Toyota competitor.
Of the 21 years analyzed through FIXD sensor data, the Frontier was more reliable for eight years compared to the Tacoma’s seven years. There was an engine reliability tie for six years.
There are certainly individual years where the Tacoma outscores the Frontier, like 2001 and 2008. Yet, the coin flips in the Frontier’s favor, such as in 2005 and 2013. There’s a lot of back-and-forth.
In short, unless you drill into a specific model year, you can’t say the Tacoma is more reliable than the Frontier or vice versa.
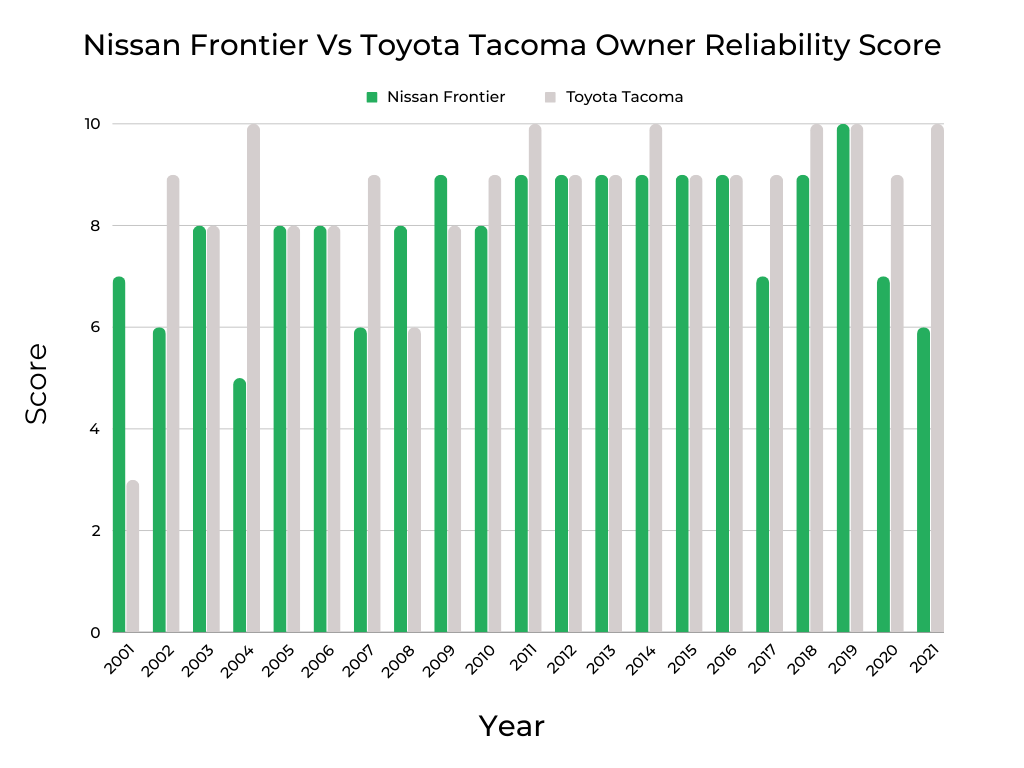
Check engine lights (CELs) don’t prevent owners from thinking highly of their Frontier and Tacomas. Of course, some CELs are more about nuisance issues (like a loose gas cap) than wallet-draining repairs. Nonetheless, Owner Reliability Scores for the Frontier and Tacoma are quite favorable. Except for the 2001 Tacoma and 2004 Frontier, this truck pair scored an above-average 6 (out of 10) or better.
Review the Best and Worst Years articles on the Nissan Frontier and Toyota Tacoma to learn more about these vehicles’ FIXD Reliability and Owner Reliability Scores.
Longevity Comparison | Nissan Frontier vs. Toyota Tacoma

One thing’s for sure: Frontiers and Tacomas have no problem reaching 150,000 miles. Many of these trucks are well on their way to or past the 200,000-mile benchmark. Trucks are supposed to be rough and tumble, and nothing points to the contrary for the Frontier and Tacoma.
Owner-reported mileage (via FIXD surveys) is especially impressive for the 2005 Frontier that crossed into the rarified zone of a quarter million miles, ultra-high-mileage territory.
I was curious to see that all surveyed Frontiers from 2001-2010 hit or exceeded the 150,000-mile mark, which applied to only 60% of the same-year Tacomas. Was this due merely to lower usage, or did this point to a longevity shortfall?
A look at marketplace data provides some insight. An unscientific review of autotrader.com (January 30, 2024) shows 334 Frontiers and 1,107 Tacomas available from 2001 to 2010. Of these listings, 47 Frontiers (14.1%) and 260 (25.6%) Tacomas have at least 200,000 miles.
These results suggest that the Tacoma can indeed have an odometer with 200,000 miles (or more). Further, one could argue that the odds favor the Tacoma of having a greater lifespan than the Frontier.
For a more thorough look at longevity, review the individual articles on the best and worst years of the Nissan Frontier and Toyota Tacoma.
Who Should Buy These Cars: The Legacy of Nissan Frontier vs. Toyota Tacoma
Expect similar usage with similar vehicles. For the most part, this is true with the Nissan Frontier and Toyota Tacoma. FIXD survey shows these sets of owners have near-identical usage patterns. About one-fourth of Frontier and Tacoma operators rely on their trucks for family transportation and “lots of driving” (a category reflecting commuting and travel).
Unsurprisingly, an average of 29% of owners use the Frontier and Tacoma for hauling and towing. Meanwhile, about 13% of those with a Frontier or Tacoma in the driveway use their truck to explore the great outdoors.
| Frequent Use Categories: | Nissan Frontier | How Useful? (Out of 5 Stars) | Toyota Tacoma | How Useful? (Out of 5 Stars) |
| Family Vehicle | *** | *** |
| Lots of Driving (travel/long commute) | *** | *** |
| Hauling/Towing | **** | *** |
| Office on Wheels | * | * |
| Sport/Fast Driving | * | * |
| Luxurious Driving | * | * |
| Outdoor/Off-Road | ** | ** |
Driver Experience | A Summary of The Top 10 Nissan Frontier vs. Toyota Tacoma Reddit Posts:
Redditors have a lot to say about the Frontier versus Tacoma matchup. Here’s an overview of comments from Reddit: r/whatcarshouldIbuy.
Comfort and Ergonomics
Many commentators have noted that the Nissan Frontier offers a more comfortable seating position, especially for taller drivers. After test-driving a Tacoma, one user found the seating position to be car-like and uncomfortable, with the roof being too low for someone 6′ 3” tall. On the other hand, the Frontier was praised for its comfortable seating during long road trips despite the steering wheel not telescoping out. Another user echoed this sentiment, stating that the Frontier’s cabin is substantially more comfortable for anyone over 5′ 10″.
Performance and Features
Regarding performance, the Frontier’s engine and transmission were highlighted as feeling nice and on par with the Tacoma’s. A user who bought a 2023 Frontier mentioned its rear disc brakes and wireless Apple CarPlay, features not available in the current Tacoma. However, there’s anticipation for the new generation Tacoma, which will have a four-cylinder engine with a hybrid power option. Despite this, some users expressed concerns about the reliability of turbos in trucks.
Value and Resale
The Frontier is often seen as a better value, being cheaper than a Tacoma with similar specs and features. However, the Tacoma is known for its superior resale value. One commenter pointed out that used Tacomas with high mileage still command high prices, a testament to their enduring value.
Overall Impressions
While the Tacoma is praised for its reliability and resale value, some users feel it’s overrated, especially in terms of comfort and the driving experience. Meanwhile, the Frontier is appreciated for its comfort, value, and features, though it’s often seen as a less popular choice than the Tacoma.
Best & Worst Years | Nissan Frontier vs. Toyota Tacoma | 2001-2024

There aren’t many options for buying an older (and cheaper) Frontier or Tacoma. At least there are twice as many options for the Frontier (2006 and 2009) than the Tacoma (2002).
Move up a few years, and choices expand, particularly for the Tacoma. Except for 2016, the 2011-2021 model years all get a green light. Shopping for a newer Frontier requires more selectivity. Only the 2012-2013, 2018, and 2020 editions get a best-years designation.
I’ll also call attention to the undecided years (yellow) only because there isn’t enough information to give these editions a thumbs up or down.
Important Features Timeline | Nissan Frontier vs. Toyota Tacoma

Except for a few features (heated front seats and a power front passenger seat), the Frontier takes a back seat to the Tacoma for equipment availability. This is primarily due to the importance of the Tacoma to Toyota’s bottom line. In 2021 (the last year before an all-new Frontier), Toyota sold more than 250,000 Tacomas, while Frontier sales lagged far behind at 60,000.
This underscores that a popular vehicle is more likely to get an investment from an automaker. But 2022 saw the launch of the third-generation Frontier. Ensuring its new pickup at least kept up with the competition, Nissan added many features (blind-spot monitoring, lane departure warning, Apple CarPlay, and Android Auto) to the Frontier for the first time.
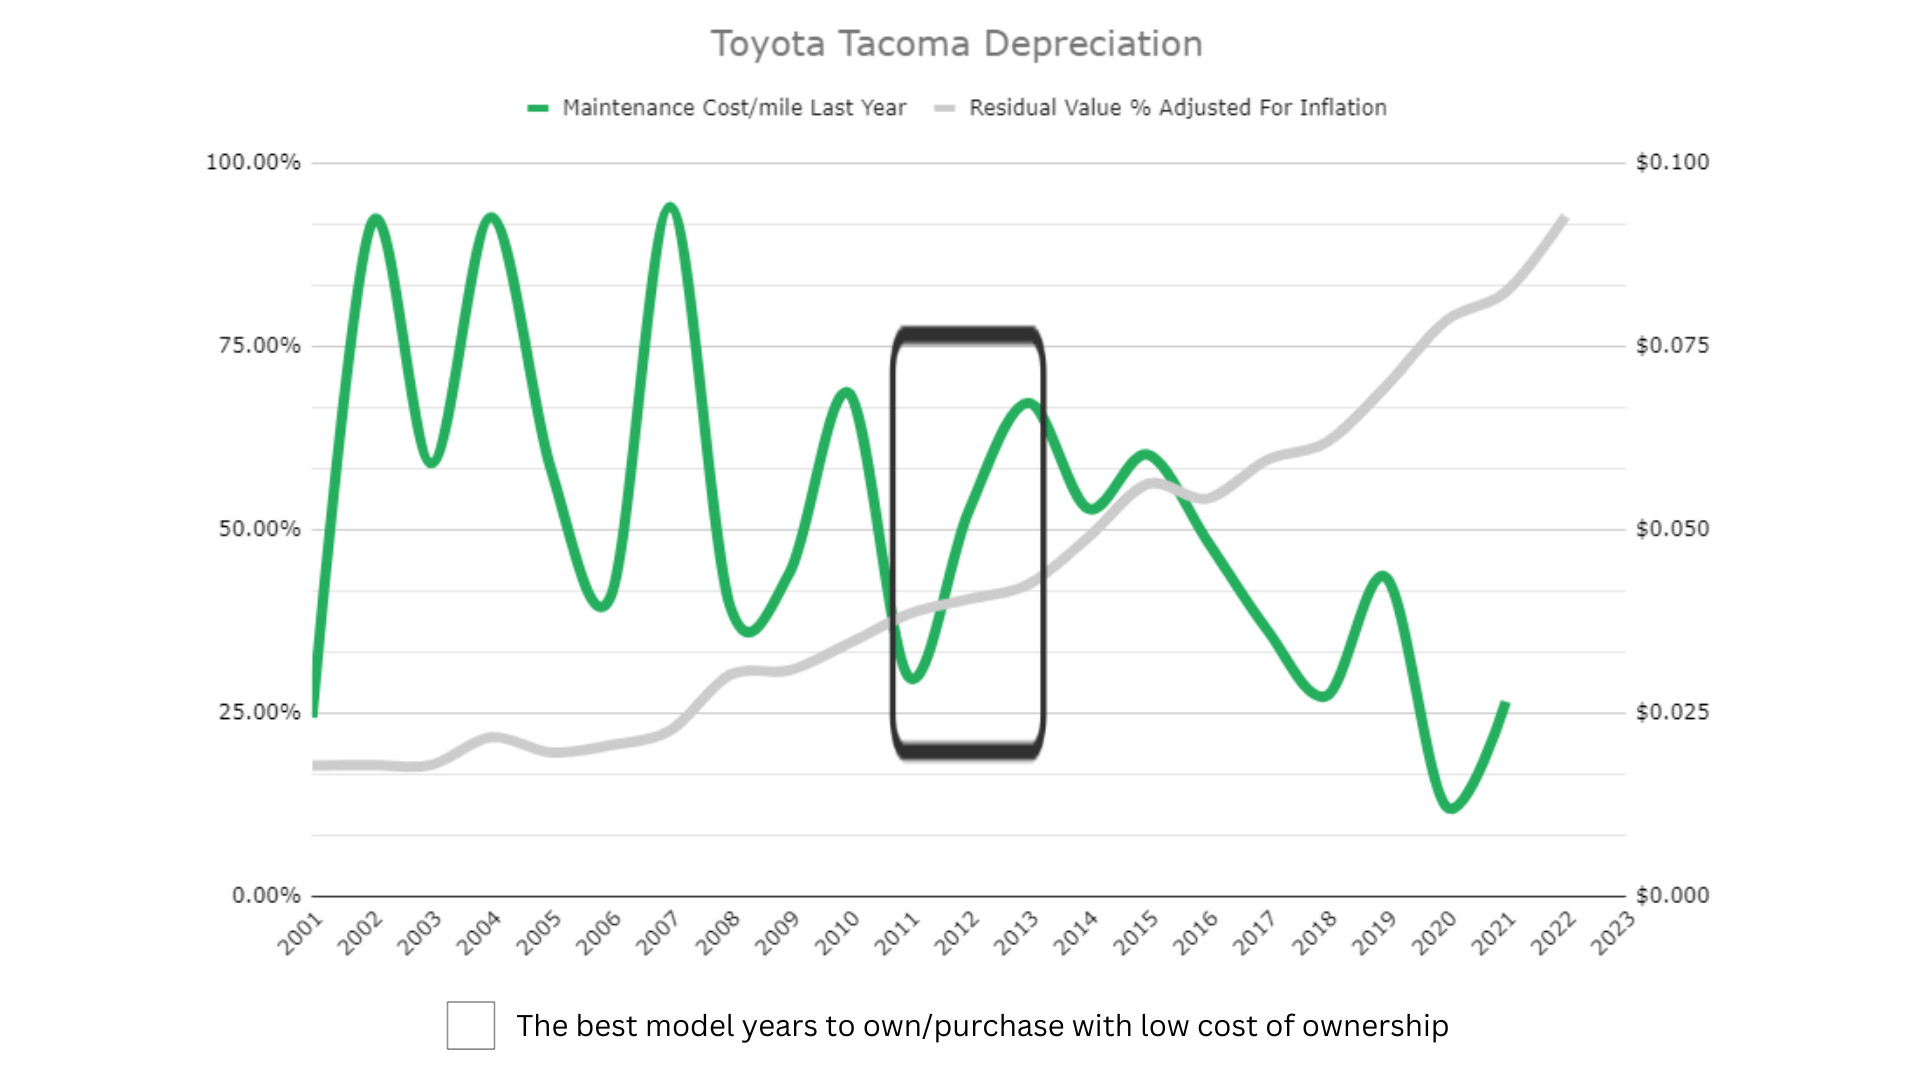
Maintenance Costs (Year-by-Year Average) | Nissan Frontier vs. Toyota Tacoma

FIXD survey results show that the Tacoma comes out ahead with lower maintenance and repair costs. On average, Tacoma owners spent $515 in 2022 to keep their pickups in good operating condition. Meanwhile, Frontier owners spent $627, 22% more. In comparison, RepairPal reports that the average among all midsize trucks is $548.
Overall averages provide a “ballpark” idea about ownership, but year-specific details can be more insightful. In particular, owners of the 2002, 2004, 2007, 2008, and 2010 Frontiers had upkeep expenses that exceeded the average ($627) by 20% or more. The same (outlays exceeding the average by at least 20%) happened to owners of a 2002, 2004, 2007, 2014, and 2015 Tacoma.
No two trucks or owners are alike. A well-maintained vehicle may have more upfront maintenance and repair expenses due to a preventative approach but lower long-term costs. On the contrary, a “used and abused” truck is likely to incur reactive repairs that are higher.
Review the best and worst years of the Nissan Frontier and Toyota Tacoma to learn more about maintenance and repair costs for these vehicles.
Safety Rating Comparison | Nissan Frontier vs. Toyota Tacoma

Some Frontier and Tacoma model years received similar ratings from the National Highway Traffic Safety Administration (NHTSA). Yet, this doesn’t apply to all 21st-century examples. Clearly, there are older years where the Frontier performs better. On the other hand, the Tacoma has its years where it shines in government crash tests. To put everything in perspective, I consider a “good” NHTSA score at least 4.0 out of 5.
Some of the disparity can be explained by the introduction of more stringent testing by NHTSA in 2011, which accounts for the Frontier’s poor showing from 2011 to 2014. Nissan took several years to engineer a remedy.
However, there’s no excuse for the Frontier’s sub-par ratings for the 2021 to 2023 model years (especially because 2022 is the first year of an all-new design). It’s a definite head-scratcher and a sure-fire reason for a safety-conscious buyer to choose a late-model Tacoma over an equivalent Frontier.
More details about crash test safety scores are covered in the Nissan Frontier and Toyota Tacoma articles.
Fuel Efficiency Comparison | Nissan Frontier vs. Toyota Tacoma

No one buys a truck to save on gas. An ability to haul and tow requires a more robust frame, extra power, and a ruggedized transmission, all elements that zap fuel economy. This vehicle class’s EPA ratings in the 15-20 mpg range are typical. If you need better fuel economy, it’s time to downsize your dreams.
That said, there are a few years where the Tacoma offers marginally better fuel economy than the Frontier. A 1-2 mpg advantage won’t save much money, but it’s better than nothing.
Curious about fuel economy for a new Frontier or Tacoma? Read: Nissan Frontier vs. Toyota Tacoma | 2023 Comparison.

Dave Goldberg is an automotive journalist and lifelong car fanatic. He writes for numerous enthusiast and business outlets and is an ongoing contributor to HotCars.com, one of the most popular car culture websites. When he’s not writing or driving, Dave is either under a hood or asleep. His credentials include a BA in Journalism from The George Washington University.


