
| Income Bracket | Monthly Financing Cost Range | Cash Purchase Price Range | Subaru Forester Years | Toyota Highlander Years | Best Model Year: | Why? |
| < $5k | $42 – $83 | $1,500 – $3,000 | 2002, 2004 | N/A | 2004 Forester | There are no Highlanders available at this price |
| $5k-$10k | $83 – $125 | $3,000 – $4,500 | 2009 | 2002 | 2009 Forester | The Forester has much better reliability |
| $10k-$15k | $125 – $187 | $4,500 – $6,750 | 2010-2013 | 2007 | 2013 Forester | At this price point, the Forester is more reliable |
| $15k-$25k | $187 – $312 | $6,750 – $11,250 | 2015 | 2009, 2010 | 2015 Forester | The 5-year older Highlander can’t keep up |
| $25k-$35k | $312 – $437 | $11,250 – $15,750 | 2016, 2017 | 2012, 2015 | 2017 Forester | Forester has a 10/10 FIXD Reliability Score |
| $35k-$50k | $437 – $625 | $15,750 – $22,500 | N/A | 2017 | 2017 Highlander | There are no Foresters at this price point |
| $50k $74k | $625 – $925 | $22,500 – $33,300 | 2020, 2021 | 2019, 2021 | 2021 Forester | Both models are very reliable, but the Forester is safer and more fuel-efficient |
See the methodology for the table above.
If you’re in the market for a used Subaru Forester or Toyota Highlander, you’ve come to the right place. The Subie’s Forester and the Toyota’s Highlander have been providing their services since 1998 and 2001 respectively.
With the Forester, buyers are guaranteed to find the automaker’s signature Symmetrical AWD system and a four-cylinder powerplant. Over at Toyota, the Highlander promises the automaker’s famed resale value, a reputation for reliability, and available V6 power to go with front- or all-wheel-drive.
There are other key differences here like the fact that the Toyota Highlander has offered a hybrid setup for going on 20 years and a third row of seating, neither of which have ever been an option with the Subaru Forester.
But which one is better? That’s what this comparison aims to find out. To start, we’ve sifted through all the data compiled and analyzed in our best and worst model year rankings of the Forester and Highlander. These rankings are centered on objective reliability, which is calculated using owner-installed FIXD devices.
We also take into account safety scores from the National Highway Traffic Safety Administration (NHTSA), current market values from Kelley Blue Book (KBB), fuel economy figures published on FuelEconomy.gov, and owner-reported annual upkeep costs.
But we lead with the table above as budget is surely top of mind for any buyer. You can think of it as Cliffs Notes for which used Subaru Forester or Toyota Highlander is the best option based on how much you plan to spend.
The rows in the table are broken out into ranges for income, financing costs, and purchase prices per KBB. The three columns on the right suggest Foresters and Highlanders that have already been rated “best of” in our model year rankings along with an overall best choice.
We’ll get more detailed below, but before getting too far, be sure to have a look through our used car buying checklist. For insight on other midsize crossover options, our model year rankings for the Honda CR-V, Chevrolet Equinox, and Nissan Pathfinder are good places to start.
Price History Comparison | Subaru Forester vs Toyota Highlander
Average Market Value – Based on Owners’ Self-Reported Mileages | Subaru Forester vs Toyota Highlander
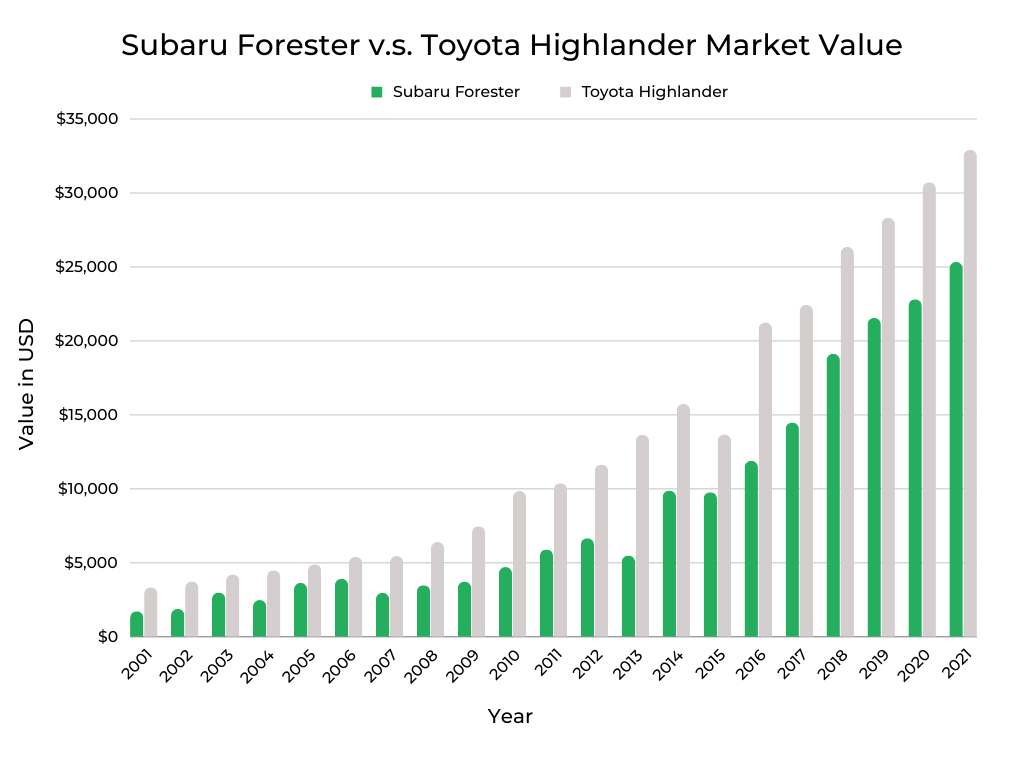
If you look over the budgeting table at the top of the page, you can see that between a market value of $1,500 and $15,750, the Subaru Foresters that fit each price range are anywhere from 3 to 7 years newer than the Toyota Highlanders available in the same range.
This correlates with the chart above showing market values for these two crossovers going back to 2001. The Highlander is more expensive than the Forester every single year, which jives with Toyota’s reputation for high resale values.
This can be partly attributed to the Highlander coming with higher price tags when new versus the Forester over this entire period. In 2001, a base Highlander was about $4,000 more than a comparable Forester. That gap increased significantly to about $12,000 by 2021.
Which makes you wonder if it’s worth paying more all else equal. We’ll look at this below, but from a reliability perspective, the answer is not necessarily as the Forester acquits itself quite well in this department. You can go deeper on this with our model year rankings series on the Highlander and Forester.
Keep in mind, these price variances can also be chalked up to mileage differences. For example, the 2013 Highlander is some $8,000 pricier than a 2013 Forester. However according to owners, these model-year Highlanders average 117,000 miles versus 155,000 for the Forester.
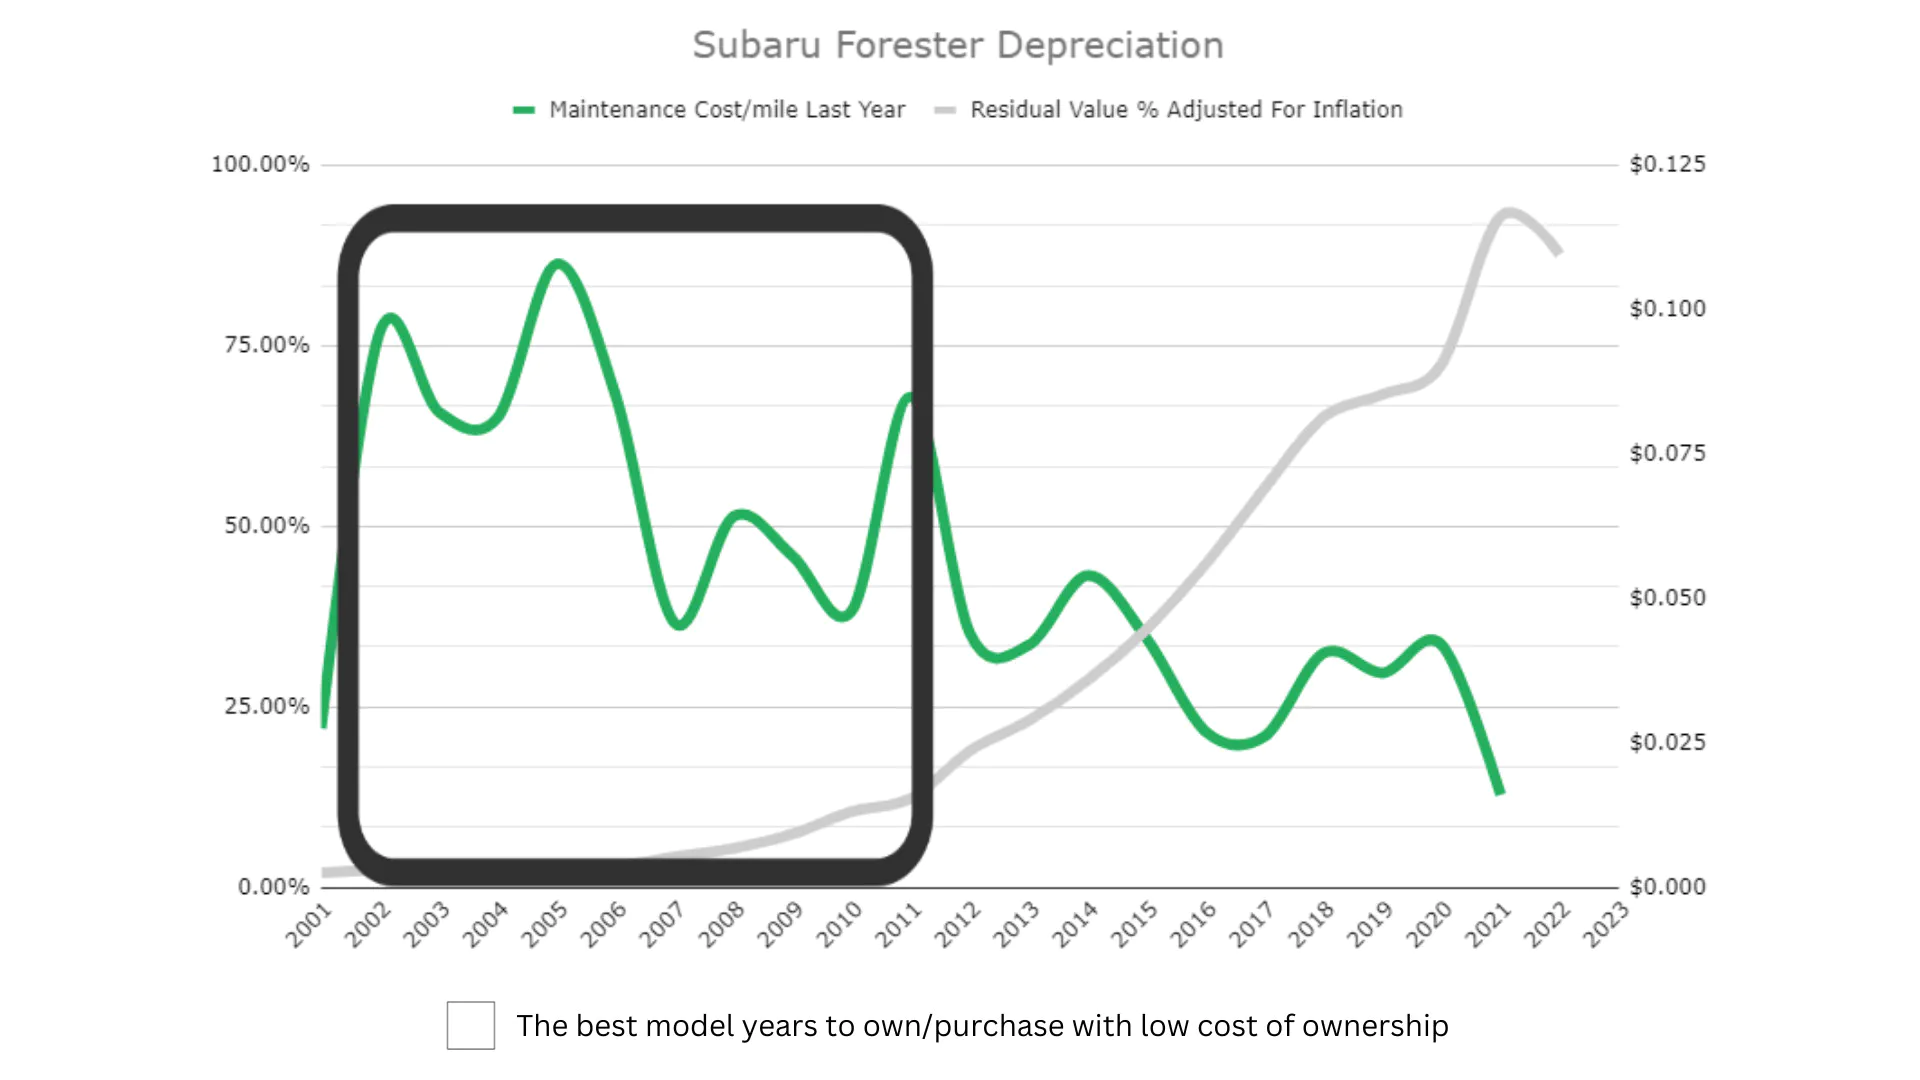
Depreciation vs Maintenance Expenses
Earlier, we suggested that paying more for a used Toyota Highlander versus a used Subaru Forester wasn’t necessarily a great idea from a reliability perspective. The chart above on the left, which plots objective FIXD Reliability Scores, shows why.
These scores, which we look at closely in our best and worst model year rankings of the Subaru Forester and Toyota Highlander, are data-driven objective figures. And the facts show that between 2001 and 2021, the Forester is objectively more reliable than the Highlander 9 times.
The gap in scores is particularly out of balance in 2020, a year that the Forester earned a thumbs up for reliability and the Highlander came home with a thumbs down. However, it was the other way around in 2007 and of course, the Toyota fared well too with a higher reliability score than the Subaru 7 times.
But based on the chart above on the right, you wouldn’t know the Subaru is as reliable, if not more than the Toyota. This chart shows how reliable owners think their SUV is and as you can see, it’s a more even set of data.
This subjective data is especially interesting in 2006, 2008, and 2013, all of which show the Highlander scoring significantly higher than the Toyota. And yet, all 3 of those Highlanders are “worst of” model years. Bottom line? Take personal insight on Forester and Highlander reliability with a grain of salt.
Longevity Comparison | Subaru Forester vs Toyota Highlander
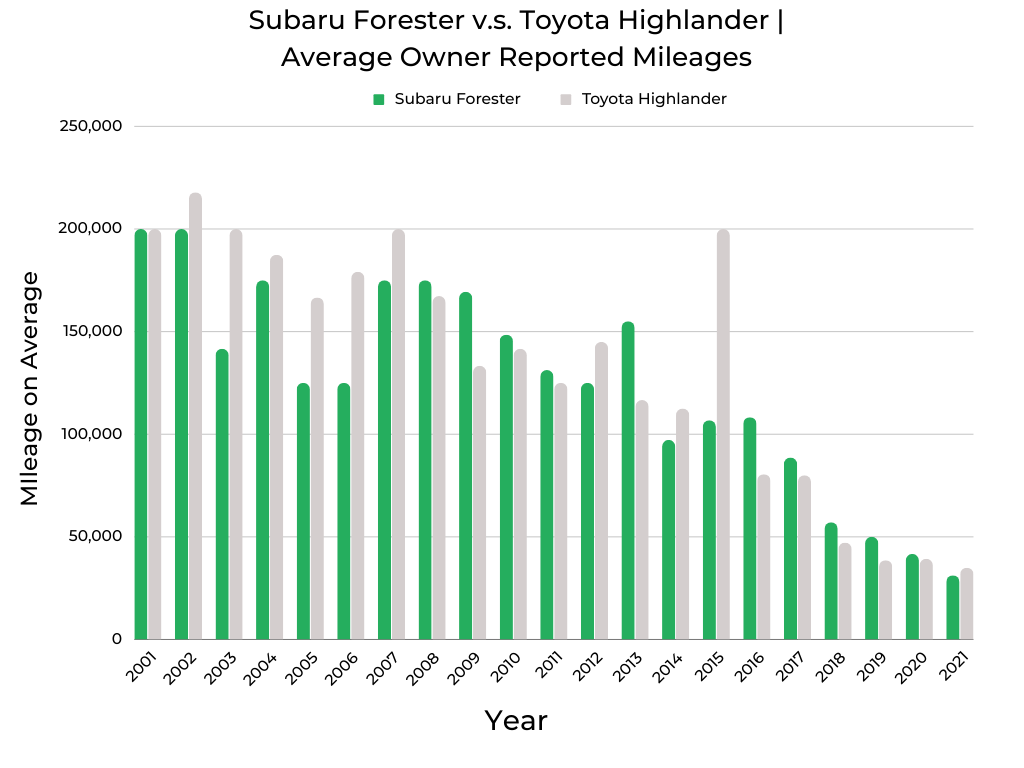
This chart shows how many miles, on average, owners of the Forester and Highlander have accrued over the years. It’s intended to help would-be buyers get an idea of how much mileage they can expect their preferred model year to have and ensure they’re comfortable with what they consider high mileage.
As you would expect, as time goes on, the mileage piles up, and for the most part, the Subaru and Toyota follow this trend. However, the 2004 and 2005 Forester go in the opposite direction. They are also both “worst of” vehicles on the Subaru Forester best and worst model year rankings, so perhaps poor reliability played a role here.
The fact that both crossovers move past the 100,000- and 150,000-mile mark with relative ease is in part due to nearly 75% of owners of both models indicating they are primarily used for “Lots of Driving” and as a family vehicle, the latter of which surely includes road trips.
Only the 2002 Highlander cracks the 200,000-mile mark, so this milestone could be considered a stretch. That also happens to be one of the worst years of the Toyota Highlander, so is best avoided anyway.
Who Should Buy These Cars: The Legacy of The Subaru Forester & Toyota Highlander
| Frequent Use Categories: | Subaru Forester | How Useful? (Out of 5 Stars) | Toyota Highlander | How Useful? (Out of 5 Stars) |
| Family Vehicle | * * * * * | * * * * * |
| Lots of Driving (travel/long commute) | * * * * | * * * |
| Hauling/Towing | * | * * |
| Office on Wheels | * | * |
| Sport/Fast Driving | * | * |
| Luxurious Driving | * | * |
| Outdoor/Off-Road | * | * |
As you can see in the table above, Subaru Forester and Toyota Highlander owners mainly use their SUVs as family vehicles. This is worth knowing as you might assume both vehicles are therefore high performers when it comes to safety. And you would be right as we’ll look at more closely below.
Lots of driving also ranks as a typical use for these crossovers, so as long as you find yourself a reliable option – which you can do by looking over the best and worst model year series for the Forester and Highlander – you can rest easy knowing these vehicles are ready for road warrior duty.
Something else worth noting is that Highlander owners report using their SUV for hauling and towing at a slightly higher rate than Forester owners – 11% versus 9%. So, be sure to ask questions about this from the previous owner as pulling a trailer tends to increase wear and tear on any vehicle.
Driver Experience | A Summary of The Top 10 Subaru Forester vs Toyota Highlander Reddit Posts:
For more insight on a used Subaru Forester vs. Toyota Highlander that is, shall we say, a bit more blunt, we kindly direct your attention to the What Car Should I Buy Reddit. On here you can solicit unfiltered opinions from owners on their thoughts about which is best, something we did to get a general idea of where folks stand.
A common thread is that the Highlander is considered more reliable, which is a reputation that Toyota enjoys across its lineup. And yes, the Highlander fares well in objective reliability, but as we know from earlier, the Subaru Forester outdoes the Toyota over 20 years for this metric.
Something several Redditors commented on was how the Highlander has gotten more expensive. Again, that’s spot on as the price gap has increased by $8,000 from 2001 to the present day over the Forester.
Notable high points for the Forester include “big tall windows” that offer excellent visibility and a more robust aftermarket for those looking to take their Subaru camping and on other outdoor excursions. However, several people were pointing out the undeniable fact of the hybrid Highlander’s fuel economy supremacy.
As with any online reviews, it’s important to sift through the nonsense and find information from reasonable folks, which is part of the fun.
Year-by-Year Comparison | Subaru Forester vs Toyota Highlander
Best & Worst Years | Subaru Forester vs Toyota Highlander | 2001-2024
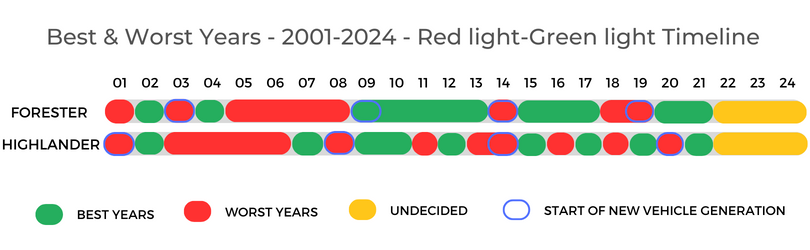
As I’ve mentioned a few times, I’m pulling a lot of insight for this used Subaru Forester vs. Toyota Highlander comparison from our best and worst model year series. But these articles are in-depth, so in the interest of brevity, we’ve put together the above graphic that condenses all that insight into an easily digestible timeline.
Any model years within the green are considered “best of”, while those in the red are “worst of”. The yellow sections are model years that we do not yet have enough data to make an accurate call on reliability. You’ll also notice some years have a blue circle.
This indicates the start of a new generation, which is an occasion often accompanied by reliability trouble as an automaker works through production kinks. This is the case for the first year of every Forester and Highlander generation as every blue-circled model year is sitting in the red zone.
If you were to overlay this best and worst model year info for the Subaru Forester with the depreciation graphic from earlier, you would find that the 2002, 2004, and 2009-2011 model years are in both the green zone and the sweet spot making them ideal used options. With the Toyota, only the 2007 model year is a “best of” Highlander and in the depreciation sweet spot.
Important Features Timeline | Subaru Forester vs Toyota Highlander
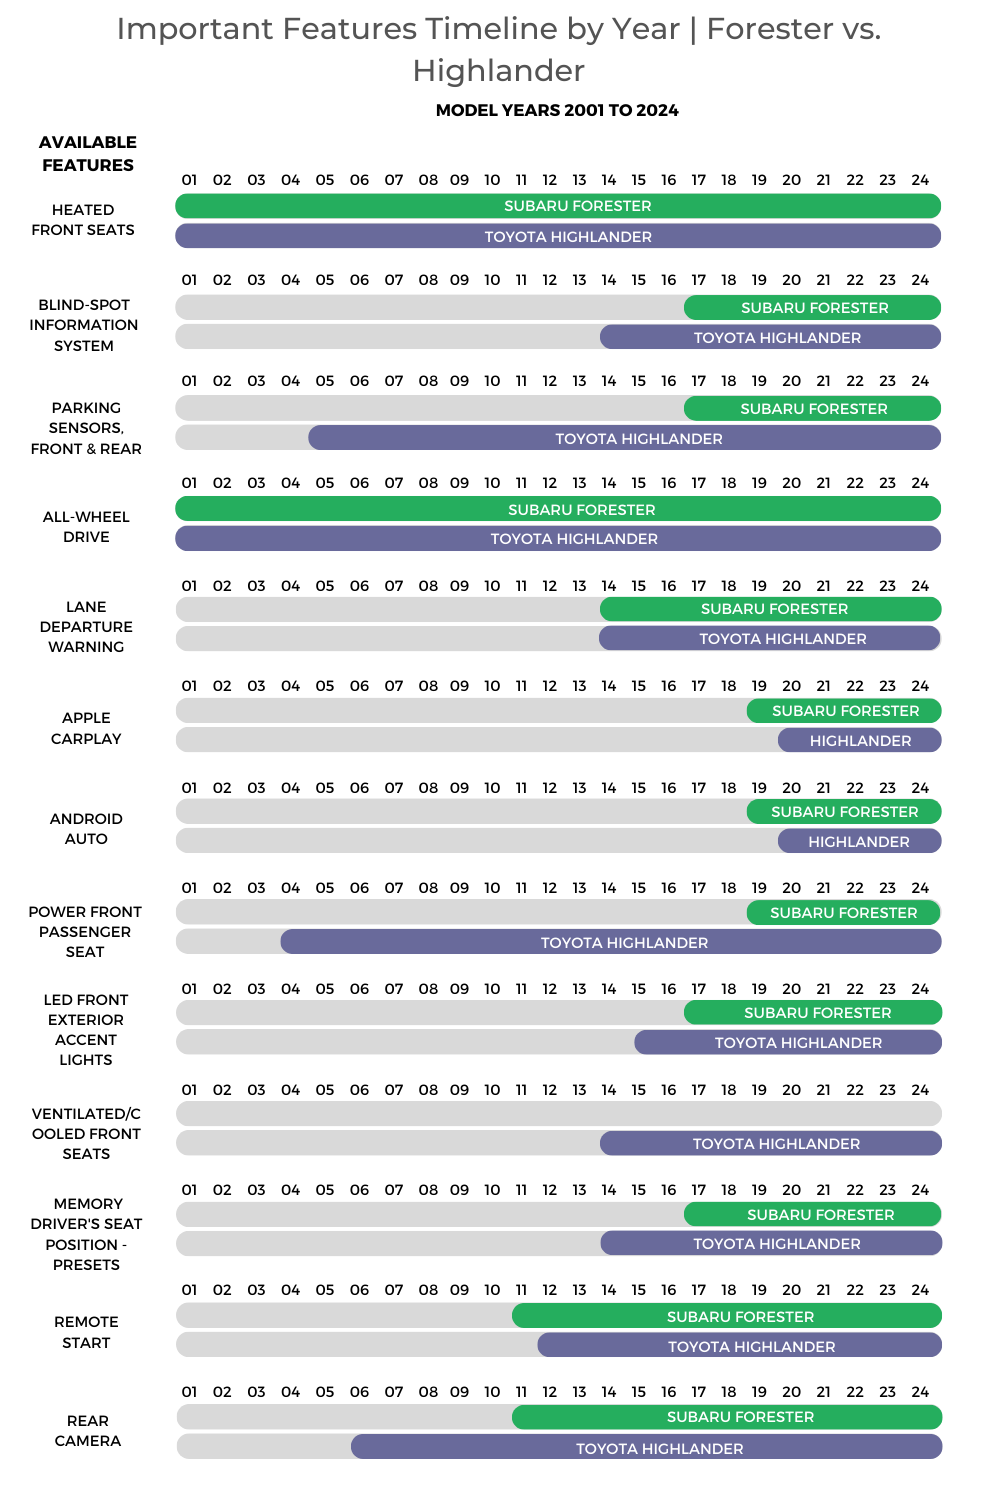
Forgetting about reliability and data for a moment, we can agree that sometimes you just want heated seats and Apple CarPlay. That’s where the above features timeline graphic comes in as it shows when coveted features first arrived on the Forester and Highlander.
Both SUVs have offered heated front seats since at least 2001, but only the Toyota has ever made ventilated front seats available – since 2014 – which is one reason these crossovers tend to be more expensive.
Apple CarPlay and Android Auto, modern must-have infotainment technology, showed up with the 2019 Forester and one year later on the Highlander. But backup cameras go back to 2006 in the Toyota and 2011 in the Subaru.
Advanced driver-assistance aids are the talk of the automotive town these days, but you could get blind-spot monitoring 10 years ago in the Toyota Highlander with the Subaru Forester following 3 years later.
A couple of important features not shown here are AWD, hybrid power, and manual transmissions. Though the Highlander has always offered AWD, only the Forester has had it as standard equipment from day one. And if you want a stick, it’s the Forester or nothing, but you have to go back to at least 2018 to find one.
It’s the other way around for hybrid fans as only the Highlander has ever offered it, starting in 2006. You can go deeper into these details with the best and worst model year rankings of the Subaru Forester and Toyota Highlander.
Maintenance Costs (Year-by-Year Average) | Subaru Forester vs Toyota Highlander
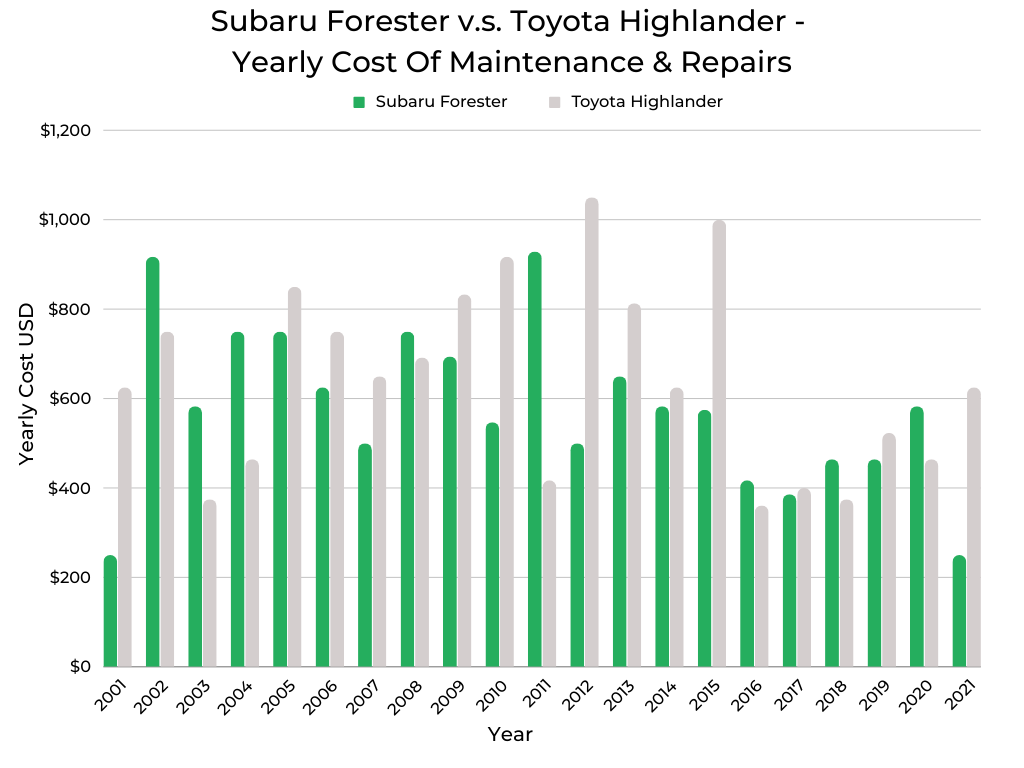
The chart above shows how much Forester and Highlander owners spend each year, on average, on maintenance costs. If it looks like the Toyota (gray bars) is generally higher than the Subaru (green bars), that’s because the Highlander averages $646 per year in upkeep costs versus $579 for the Forester.
Furthermore, the Toyota Highlander hits the $1,000 mark twice, while the Subaru Forester never does. But don’t assume high bills translates to poor reliability as an owner who is meticulous with maintenance will rack up higher costs than an owner that runs their car into the ground and rarely takes it into the shop.
So, make sure to do your homework by reviewing the service history with the previous owner. You can also read up on the model year rankings for the Subaru Forester and Toyota Highlander to get a sense of where to focus your energy.
Safety Rating Comparison | Subaru Forester vs Toyota Highlander
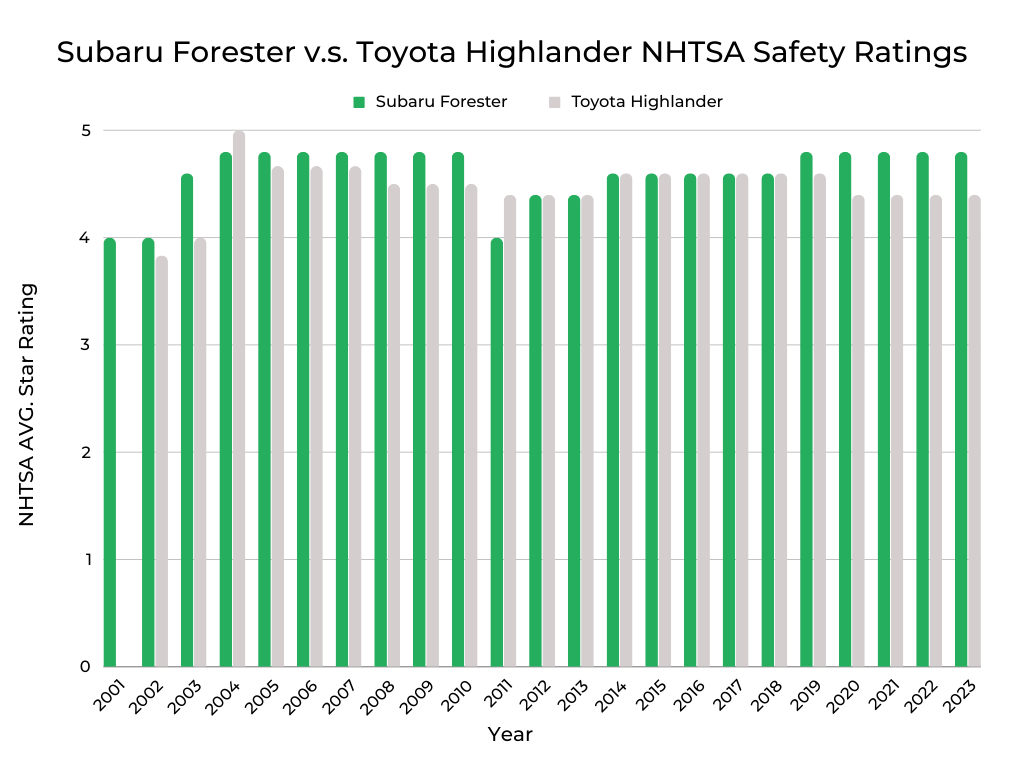
As mentioned earlier, the Forester and Highlander are primarily family vehicles, so you would expect them to have strong safety ratings. Looking over the above table that compares NHTSA scores from one year to the next, you can see this is indeed the case.
The only time either of these SUVs didn’t earn at least 4 out of 5 stars was the 2002 Highlander. Something covered in the model year rankings for the Subaru Forester and Toyota Highlander is that in 2011, the NHTSA instituted new stricter crash test protocols.
You can see the results of this on the chart as both crossovers post a decline that year. And though the Subaru has had higher ratings over the past 5 model years, that doesn’t diminish the fact that the Highlander is also a safety star.
Fuel Efficiency Comparison | Subaru Forester vs Toyota Highlander
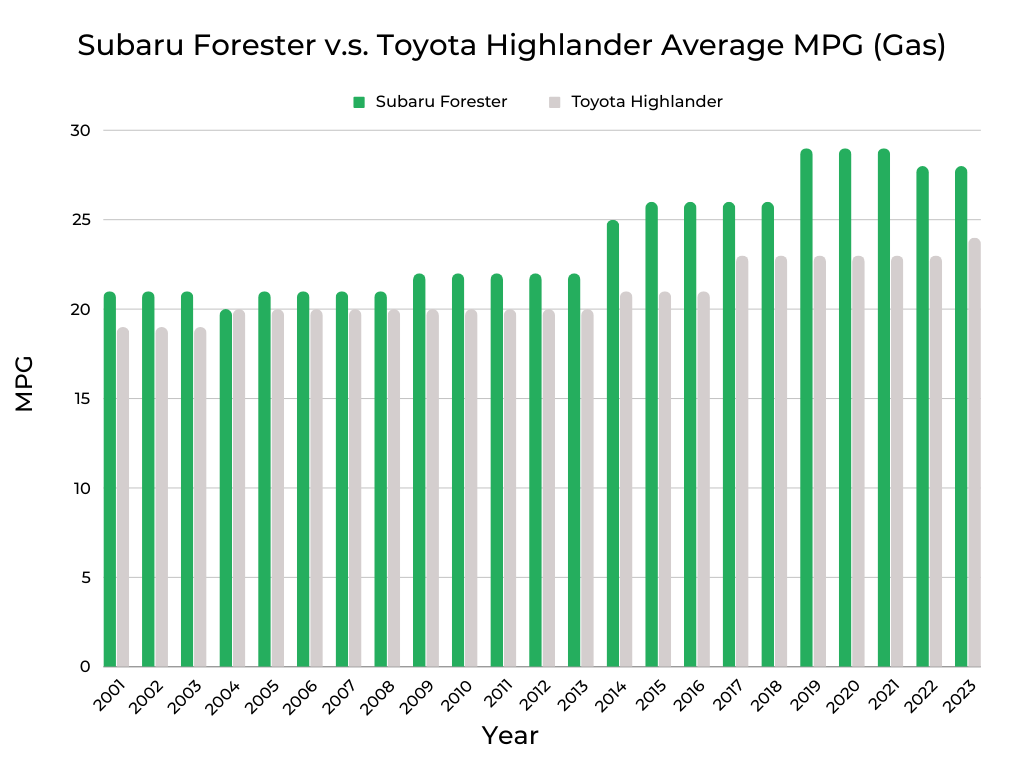

No car comparison would be complete without a look at fuel efficiency. The chart above on the left compares how the Forester and Highlander have fared in this department over the past 20 years. It leaves little doubt that the Subaru (green bars) is overall more fuel efficient than the Highlander (gray bars) for traditional powertrains.
Part of that is due to the Subaru only ever offering four-cylinder motors. The Highlander can be had with a four-pot, but also offers a more powerful – and thirstier – V6 that drives the average down. That being said, only the Toyota Highlander has ever offered a hybrid powertrain.
This is the data shown above on the right and as can see, these are the true fuel economy champs. If you’re leaning towards the Toyota, look to the 2007 model as it offers hybrid efficiency, sits in the depreciation sweet spot, and is on the right side of the Highlander’s best and worst model year rankings.
Those in the Subaru camp would do well to focus on the 2009-2011 models as they hit the depreciation sweet spot and are on the “best of” side of the Forester model year rankings while offering the highest fuel economy figures using those criteria.

Niel Stender grew up doing replacement work on his old Cherokee and sweet Mitsubishi Starion, which led to a degree in mechanical engineering and a job at Ford as a vehicle dynamics engineer. His writing infuses that automotive background with sales and marketing experience. Writing about cars for close to a decade now, he enjoys digging into some of the more technical mechanical systems under the hood and throughout a vehicle.


