
Shopping in today’s still turbulent used car market requires flexibility. You may have a Toyota 4Runner SUV in mind, but realize that a more civilized Subaru Outback better meets your needs. Conversely, it’s reasonable to think that an Outback is rough and ready enough, only to discover its off-road capabilities are more limited.
As utility vehicles, the 4Runner and Outback are somewhat opposites. There’s no escaping this Toyota’s Tacoma DNA. The couple of times I’ve been behind the wheel of a 4Runner, I’ve noticed its truck-like qualities: a firm ride and less precise handling. Yet, these same qualities are ideal when travels go beyond the pavement.
In contrast, the Outback is far nimbler, and depending on what’s under the hood, this Subaru can actually be fun to drive. While the Outback has all-wheel drive, I wouldn’t always venture to the same places I’d take a 4Runner.
Still, other factors to consider include cost, depreciation, reliability, longevity, safety, and fuel economy. Keep reading to learn how these fundamentals may influence a buying decision in this 4Runner versus Outback matchup.
Perhaps the greatest surprise is that the 4Runner’s engine reliability isn’t as solid as its reputation. In some model years, the 4Runner’s check engine light frequency is far worse than the Outback’s. Yet, the Outback isn’t a prime example of dependability either.
What’s not unexpected is that you’ll pay more for a 4Runner than a comparable Outback. There’s no escaping that modest depreciation that usually accompanies many Toyota models, including the 4Runner. At least 4Runners are cheaper to maintain than Outbacks. At the same time, better fuel economy can save Outback owners some money.
There are many of these back-and-forth issues to understand before deciding whether the Toyota 4Runner or Subaru Outback is better. Exploring this article will provide the necessary insights.
Keep reading to see how this Toyota 4Runner and Subaru Outback contest turns out. Other match-ups to review include Outback vs. Forester, 4Runner vs. Highlander, RAV4 vs. CR-V, Civic vs. Corolla, Pilot vs. Highlander, and Odyssey vs. Sienna.
| Income Bracket | Monthly Financing Cost Range | Cash Purchase Price Range | Toyota 4Runner Years | Subaru Outback Years | Best Model Year: | Why? |
| $5k-$10k | $83 – $125 | $3,000-$4,500 | 2003 | N/A | 2003 4Runner | Low cost, good safety score |
| $10k-$15k | $125 – $187 | $4,500-$6,750 | 2004 | N/A | 2004 4Runner | Low cost, good safety record |
| $15k -$25k | $187 – $312 | $6,750-$11,250 | 2008 | N/A | 2008 4Runner | Average engine reliability, good safety score |
| $25k -$35k | $312 – $437 | $11,250-$15,750 | 2012 | 2016 | 2016 Outback | Excellent engine reliability, excellent safety score |
| $35k -$50k | $437 – $625 | $15,750 – $22,500 | 2014 | 2018 | 2018 Outback | Excellent engine reliability, excellent safety score |
| $50k -$74k | $625 – $925 | $22,500 – $33,300 | 2018 | 2021 | 2021 Outback | Good value, top engine reliability, very good safety score |
| $75k -$99k | $925 -$1,238 | $33,300 – $44,550 | 2021 | N/A | 2021 4Runner | Top engine reliability |
See the methodology for the table above.
Curious about other car pairings? Check these articles to explore:
Volkswagen Jetta vs. Honda Civic
Before you respond to the “For Sale” ad, check out this How to Buy a Used Car article for a step-by-step checklist.
Price History Comparison | Toyota 4Runner vs. Subaru Outback
Average Market Value – Based on Owners’ Self-Reported Mileages | Toyota 4Runner vs. Subaru Outback

A glance at market values gives prospective buyers a “ballpark” idea of what a used 4Runner (green) or Outback (gray) might cost. The chart is based on Kelley Blue Book (KBB) data covering private-party sales. Expect to pay 30%-50% more at a dealer. If retail prices aren’t within your budget, consider shopping for an older vehicle or one with higher miles or less equipment. The above market values also incorporate owner-reported mileage from FIXD surveys. Adding this information provides a more realistic look at prices.
It’s hard to miss that a pre-owned 4Runner sells for more than a used Outback from the same year. That’s good news if you’re Subaru shopping, but not so much if a Toyota is on the list. Two factors lead to this disparity: original MSRP and depreciation.
In 2008, the cheapest 4Runner came with a $34,804 window sticker, while the starting price for a base Outback was $24,286. There’s a similar gap for 2015, with the 4Runner beginning at $35,670, compared to $26.045. In a nutshell, there’s an approximate $10,000 gap in the original MSRPs.
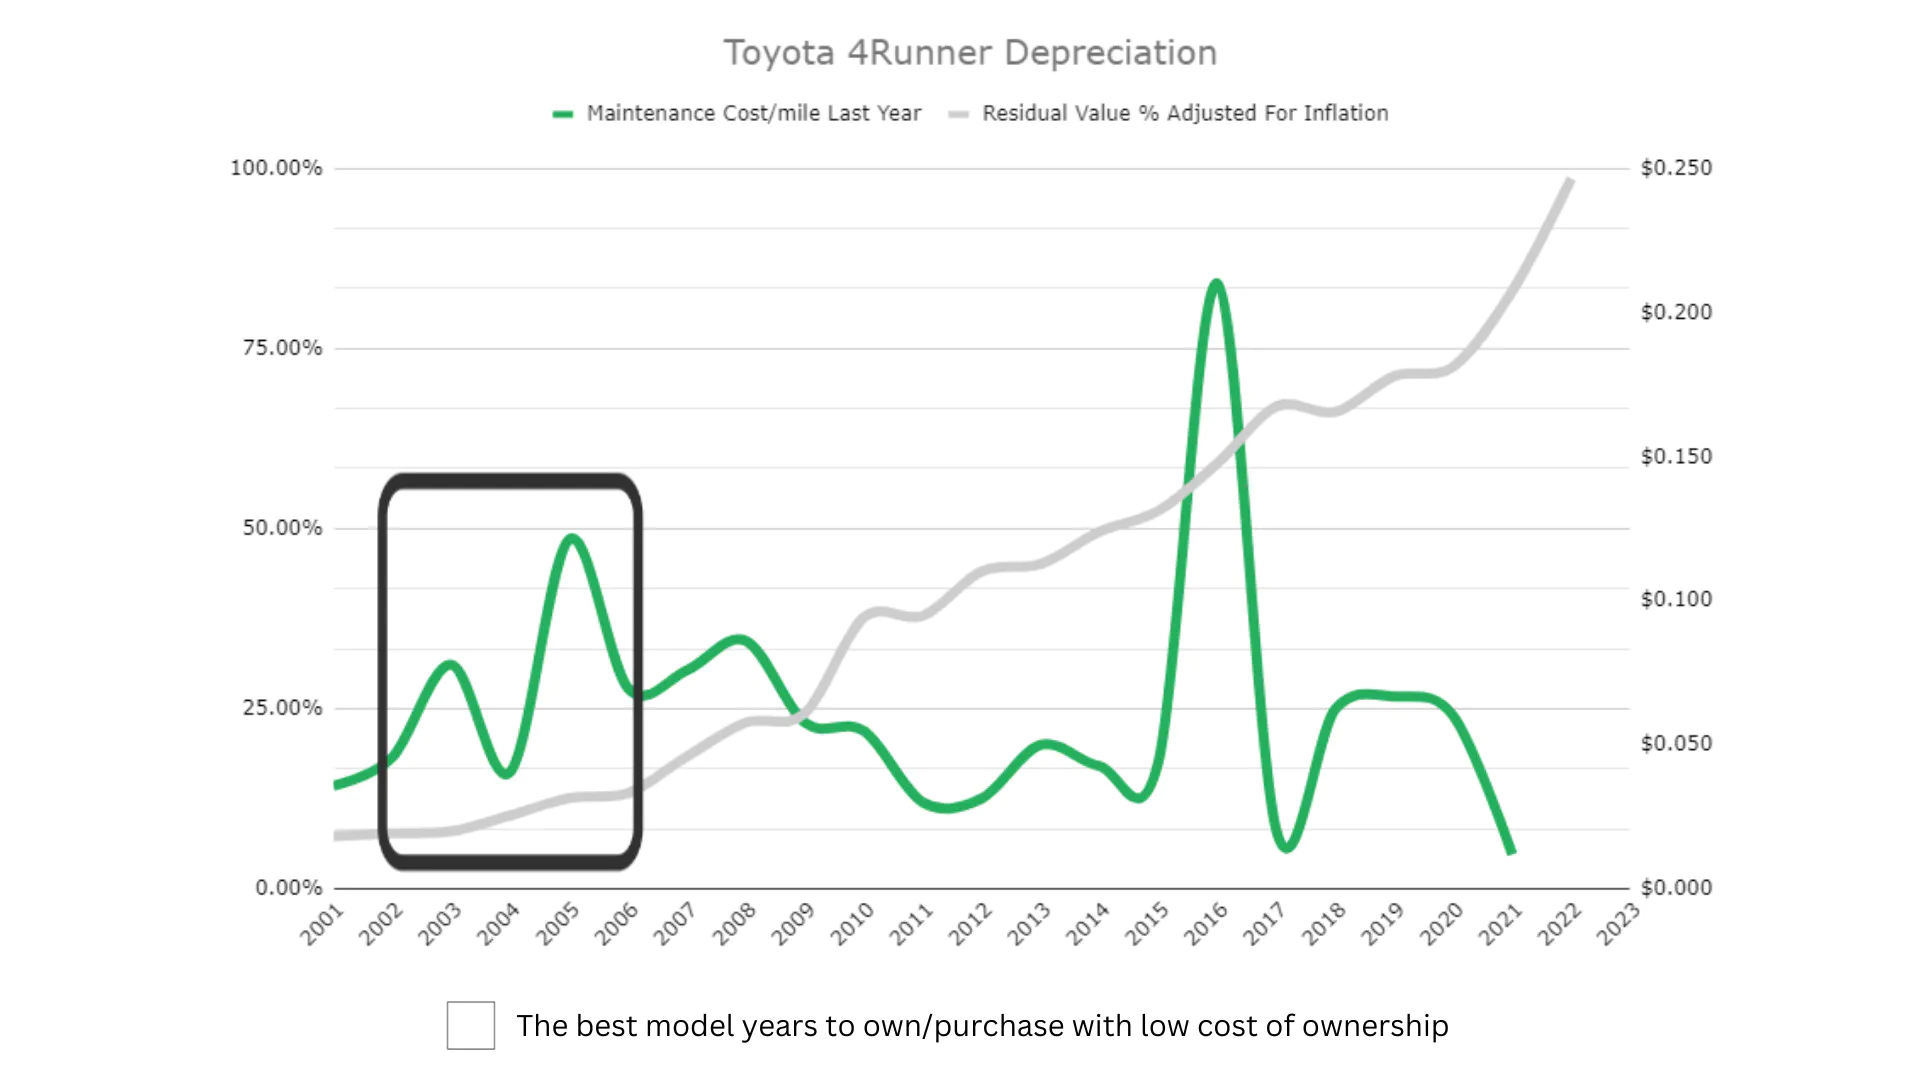
Depreciation is the other part of the equation. Like other Toyotas (such as the Tacoma pickup), the 4Runner is a low-depreciation champion. CarEdge estimates that a 4Runner only loses 19% of its original value during the initial five years. It’s an impressive achievement but one that leads to high prices for used 4Runners. However, Outbacks also hold their value, just not as well as the 4Runner. During its first five years, an Outback gets hit with 24% depreciation, reports CarEdge.
So, that $10,000 contrast in original prices and depreciation gap explains why a used 4Runner costs more. If your primary focus in comparing the 4Runner to the Outback is price, then you’ll have a hard time spending less for the Toyota unless there are sacrifices (age, mileage, condition, etc.). That said, the dollar amount differences lessen among older examples as depreciation tends to even out after 15 years.
The significant value disparity between the 2016 4Runner and Outback is explained by the 4Runner’s below-average reported mileage.
Be sure to read our Best and Worst Years series of articles highlighting the Toyota 4Runner and Subaru Outback winners and losers.
Depreciation vs. Maintenance Expenses
There’s no clear victor in the 4Runner versus Outback engine reliability contest. Of the 21 years reviewed, the 4Runner can claim victory for ten, while the Outback is ahead for nine years. That’s much different.
However, the FIXD Reliability Scores can be very insightful if your search involves specific model year comparisons. For instance, the 2006 4Runner scrapes the bottom of the barrel with a 1, while the same-year Outback gets an average 5 rating. An even more extreme example involves the 2016 model year. Again, the 4Runner scores a 1, which falls far short of a near-perfect 9 for the Outback.
As mentioned, there are winning engine reliability years for the 4Runner, just not with a FIXD Reliability Score gap as great. Except for 2009, no 4Runner model year has more than a three-point spread above the Outback. Outback engine reliability is three points or more above the 4Runner for three model years.
If you’re curious about how the notorious Subaru head gasket issue comes into play, the Best & Worst Years section toward the end covers this.
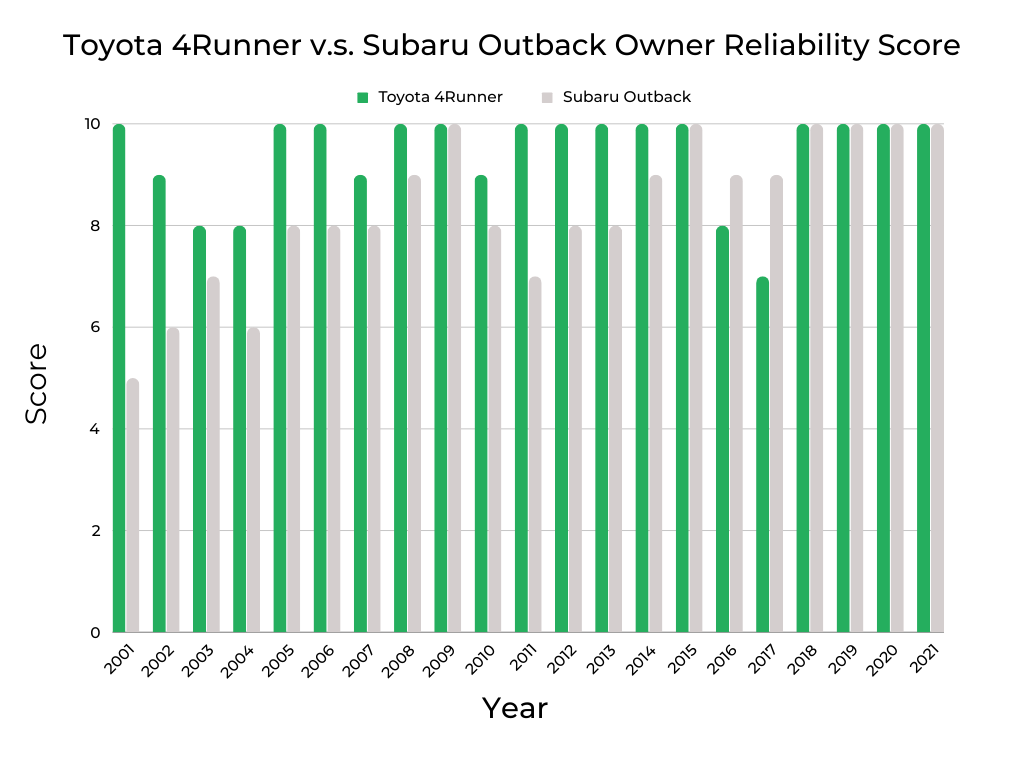
Regardless, check engine light (CEL) frequency doesn’t influence what owners think of their 4Runners and Outbacks. Owner Reliability Scores are overwhelmingly high, especially for the 4Runner.
Those with a 4Runner in the driveway give their SUVs at last an 8 (out of 10) for every year except 2017. Further, 4Runners rated 10 for 14 out of the 21 surveyed years. Outback owners only gave their cars a perfect score for 6 years. The Outback still comes across favorably, with most model years hovering around an 8. Some pre-2005 examples fared less well but never dipped below 5.
Review the Best and Worst Years articles on the Toyota 4Runner and Subaru Outback to learn more about these vehicles’ FIXD Reliability and Owner Reliability Scores.
Longevity Comparison | Toyota 4Runner vs. Subaru Outback

As with most modern vehicles, 4Runners and Outbacks crossing the 150,000-mile mark is an everyday occurrence. But what’s not so ordinary is approaching or crossing the 200,000-mile threshold. FIXD owners show that the 4Runner has more experience with this achievement than the Outback.
Only the 2001 and 2006 Outbacks outperformed the 4Runner when comparing model-year pairs for high mileage. This doesn’t necessarily mean that the 4Runner has better longevity prospects. Instead, this could just be the result of surveyed Outback owners not driving as much as their 4Runner counterparts.
Yet this leads to a broader question: Does the body-on-frame 4Runner have a better chance of logging more miles than the unibody Outback?
For reference, a body-on-frame vehicle has the body and frame as separate structures. This allows more flexibility in design and the ability to swap out components but isn’t as rigid (which helps in rugged off-road situations). A unibody vehicle has the body and frame integrated into one single rigid structure. This is lighter and allows more interior room, but repairs are more complex if the unibody structure gets damaged.
Let’s look at other real-world data to answer the longevity question fully. An unscientific analysis (February 6, 2024) of autotrader.com shows 956 4Runners and 886 Outbacks available from 2001 to 2012. Older years are more likely to have higher mileage.
These listings reveal 360 (37.7%) 4Runners and 285 (32.2%) Outbacks with 150,000-200,000 miles, suggesting that both vehicles have similar lifespans to this point. However, the numbers drastically changed once the 200,000-mile mark was crossed. 298 (31.2%) 4Runners and 74 (8.4%) Outbacks qualify.
This last set of numbers leads to one inescapable conclusion: the odds of reaching 200,000 miles or more are much better in a 4Runner.
For a more thorough look at longevity, review the individual articles on the best and worst years of the Toyota 4Runner and Subaru Outback.
Who Should Buy These Cars: The Legacy of Toyota 4Runner vs. Subaru Outback
FIXD owner surveys reveal that the main duty of the 4Runner and Outback are as family haulers (37% for the 4Runner and 41% for the Outback). Meanwhile, an identical amount (27%) of these owners use their 4Runners and Outbacks for “lots of driving,” which is another way of saying long commutes and road trips.
Despite the 4Runner’s greater towing ability (typically 5,000 pounds versus up to 3,500 pounds for the Outback), both vehicles hardly get used for towing. An average of 8.5% of owners reported using their vehicles for this activity. Outdoor use is somewhat more popular, with 14% of owners using their 4Runners and Outbacks to enjoy the fresh air.
| Frequent Use Categories: | Toyota 4Runner How Useful? (Out of 5 Stars) | Subaru Outback How Useful? (Out of 5 Stars) |
| Family Vehicle | * * * * | * * * * * |
| Lots of Driving (travel/long commute) | * * * | * * * |
| Hauling/Towing | * | * |
| Office on Wheels | * | * |
| Sport/Fast Driving | * | * |
| Luxurious Driving | * | * |
| Outdoor/Off-Road | * * | * * |
Driver Experience | A Summary of The Top 10 Toyota 4Runner vs. Subaru Outback Reddit Posts:
Many Redditors are curious about how the Toyota 4Runner and Subaru Outback compare. Here’s an overview of the most popular conversations from Reddit: r/whatcarshouldIbuy.
In a Reddit discussion regarding the choice between a Toyota 4Runner and a Subaru Outback, commenters shared various opinions and experiences highlighting both vehicles’ strengths and weaknesses. One Redditor emphasized the importance of test-driving both cars to make an informed decision, noting that both Toyota and Subaru manufacture reliable vehicles. They suggested the 4Runner would be the better choice if extra towing capability is necessary.
Still, for those who prioritize fuel economy and the benefits of all-wheel drive without the need for frequent towing, the Subaru Outback would be more economical in the long run. Another user, who had experience with both vehicles, preferred the 4Runner for its towing capacity and off-road capabilities, citing the Subaru’s continuously variable transmission (CVT) as a drawback for towing.
The conversation also touched on the market conditions affecting the purchase of new vehicles, with one Redditor highlighting the inflated prices of the 4Runner due to dealer markups, which could make the Outback a more attractive option despite its own pricing challenges. However, the same commenter criticized the Outback Wilderness trim for its aesthetics and questioned the value it added over lower trims.
Despite these criticisms, another user who chose the Outback Wilderness shared their satisfaction, particularly after adding a rooftop tent, suggesting that personal preferences and intended use play significant roles in the decision-making process. Overall, the discussion reflects a mix of practical considerations, personal experiences, and market realities that potential buyers weigh when choosing between these two models.
Best & Worst Years | Toyota 4Runner vs. Subaru Outback | 2001-2024

It’s impossible to ignore the long string of red light-years (2001-2013) for the Subaru Outback. Several factors contribute to this massive thumbs-down, including poor engine reliability and high maintenance costs. These issues are tied into the infamous Subaru head gasket fiasco, a well-known problem affecting many models, including Outbacks built through 2009.
I’ve known Eddie, a used car dealer specializing in affordable vehicles, for several years. He targets customers wanting to spend up to $15,000 (it used to be $10,000) and has no problem including aging BMWs, Mercedes, and other trouble-prone cars in his inventory. But what’s the one brand he won’t sell? You guessed it: Subaru. He discovered through experience that the potential for a bad head gasket is not good business. Enough said.
Fortunately, shoppers with modest budgets still have options thanks to older 4Runners from 2003-2004 and 2007-2008. Meanwhile, the first green light-year for the Outback doesn’t appear until 2014. Funding requirements only increase as the other worthwhile Outback model years (2016-2109 and 2021) are much newer. Except for 2016 and 2019, the 4Runner gets sold recommendations for 2012 through 2021.
I’ll also call attention to the undecided years (yellow) only because there isn’t enough information to give these editions a thumbs up or down.
Important Features Timeline | Toyota 4Runner vs. Subaru Outback

The Outback is far more critical to Subaru’s bottom line than the 4Runner is to Toyota’s. In 2023, the Outback accounted for one-fourth of Subaru’s U.S. sales, while the 4Runner represented 6.2% of Toyota’s American business. Why does this matter? Automakers give their big money makers the most attention, which explains why the Outback received key equipment before the 4Runner.
This includes comfort and convenience features like heated front seats, Apple CarPlay, Android Auto, a driver’s memory system, and remote start. The Outback also had first bragging rights for safety features, such as blind-spot monitoring and lane departure warning. However, the 4Runner isn’t entirely left in the dust. It received parking sensors, a power front passenger seat, and a rear camera before the Outback.
Maintenance Costs (Year-by-Year Average) | Toyota 4Runner vs. Subaru Outback

One separator between the 4Runner and Outback is maintenance and repair costs. In 2022, the typical 4Runner owner spent $598 to keep their SUV on the road, compared to $706 (or 18% more) for the average Outback owner. In comparison, RepairPal estimates that the average annual upkeep cost for all vehicles is $652.
Looking at specific model years provides additional insights. 4Runners from 2003, 2005, 2007, 2008, 2013, 2014, 2016, and 2018 cost at least 20% more than average to maintain. In particular, owners with a 2008 4Runner spent the most at $1,100. The Outback has its share of costlier-to-own model years, too. The 2003, 2004, 2009, and 2012 editions had maintenance and repair bills that exceeded the average by at least 20%.
Review the best and worst years of the Toyota 4Runner and Subaru Outback to learn more about maintenance and repair costs for these vehicles.
Safety Rating Comparison | Toyota 4Runner vs. Subaru Outback

Buyers hyper-focused on safety will take comfort in the Outback’s superior performance in crash test evaluations from the National Highway Traffic Safety Administration (NHTSA). This Subaru’s consistently excellent scores are impressive, especially when looking at the results from 20 years ago (I’ll cover 2011 in a moment).
Is the 4Runner a deathtrap? Nope, not even close. I consider 4.0 out of 5.0 to be a minimum benchmark for a “good” safety score, and most 4Runner years get a passing grade, if just barely. Poor scores for the 2001 and 2002 editions are one reason they don’t get a green light, so it’s best to look at different model years.
In 2011, NHTSA introduced more rigorous testing standards, as evidenced by the decreased scores for the 2011 versions of the 4Runner and Outback. A 3.0 score for the 2011 4Runner is especially poor, so I’d cross this edition of your list. However, the 2011 Outback still performed well despite the new testing measures.
More details about crash test safety scores are covered in the Toyota 4Runner and Subaru Outback articles.
Fuel Efficiency Comparison | Toyota 4Runner vs. Subaru Outback

Give Subaru credit for steadily improving the Outback’s fuel economy. The 20-ish mpg rating of twenty years ago nudged up to 25 mpg or better in more recent years. Meanwhile, the 4Runner’s fuel economy consistently hovers below 20 mpg.
If fuel savings is a priority, then the Outback is the obvious choice.

Dave Goldberg is an automotive journalist and lifelong car fanatic. He writes for numerous enthusiast and business outlets and is an ongoing contributor to HotCars.com, one of the most popular car culture websites. When he’s not writing or driving, Dave is either under a hood or asleep. His credentials include a BA in Journalism from The George Washington University.


