Toyota 4Runner Engine Reliability Score, Safety Ratings, MPG, and Value v.s. Maintenance & Repair Costs Year by Year
The first chart below, Toyota 4Runner Reliability Score, is the main driver of our model year rankings. It is a combination of objective FIXD device data and subjective owner-reported information. Typically the first year of a new generation – like 2010 – will struggle with reliability as the kinks are worked out, which is reflected in the chart.
From there, we blend in published government safety scores from the National Highway Traffic Safety Administration (NHTSA) and fuel efficiency figures per fueleconomy.gov.
We also incorporate market values from Kelley Blue Book (KBB) against owner-reported annual maintenance costs. That goes into the ranking decision along with owner survey answers and pertinent safety recalls. Lastly, with details on safety recalls and common Diagnostic Trouble Codes (DTCs), we can create the final rankings below.
Engine Reliability Score – Over The Years
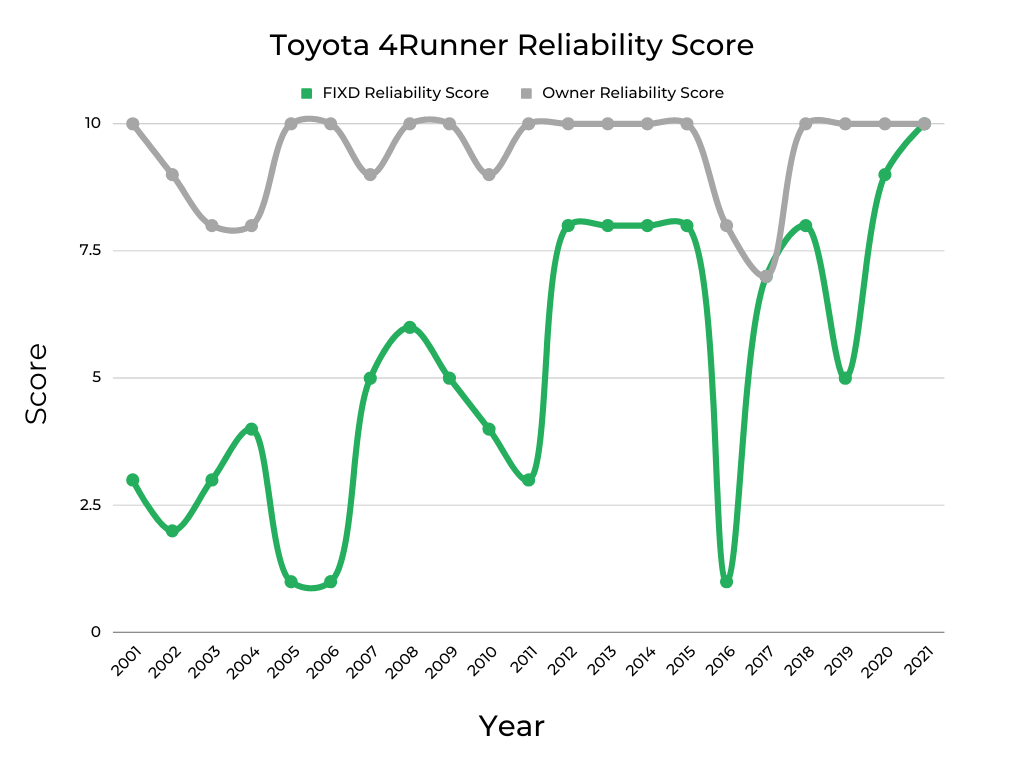
The FIXD Reliability score (green line on Toyota 4Runner Reliability chart) is based on the number of CELs thrown by each model year. After tallying them up, we weight this objective score by mileage and convert it into a 1-10 scale where 10 is the best and 1 is the worst.
By asking 4Runner owners, “How reliable would you say your car is?”, we can pull together a subjective reliability score for comparison. This multiple-choice question offers answers from “Just Point A to Point B driving” to “I could take a cross-country trip, no problem.” After converting the answer into a 1-10 scale, we create the gray line above.
Driven by owner sentiment, the gray line on this 4Runner reliability chart does an excellent job of highlighting how loyal 4Runner owners are. Over 21 years, the Owner Reliability Score rarely dips below 8/10, averages 9/10, and is a perfect 10/10 for 14 of those years. Impressive.
As you can see, the objective and subjective reliability scores mostly move in the same direction. But occasionally, like in 2005 and 2019, the scores diverge dramatically in what is typically a rebuke of the aforementioned positive owner sentiment. We’ll explain this in the relevant sections below but it helps illustrate the importance of analyzing both sets of data.
You can find out more about our reliability scoring process at the bottom of this article and learn about some of the most common CELs to expect from Toyota.
NHTSA Safety Score – Over The Years
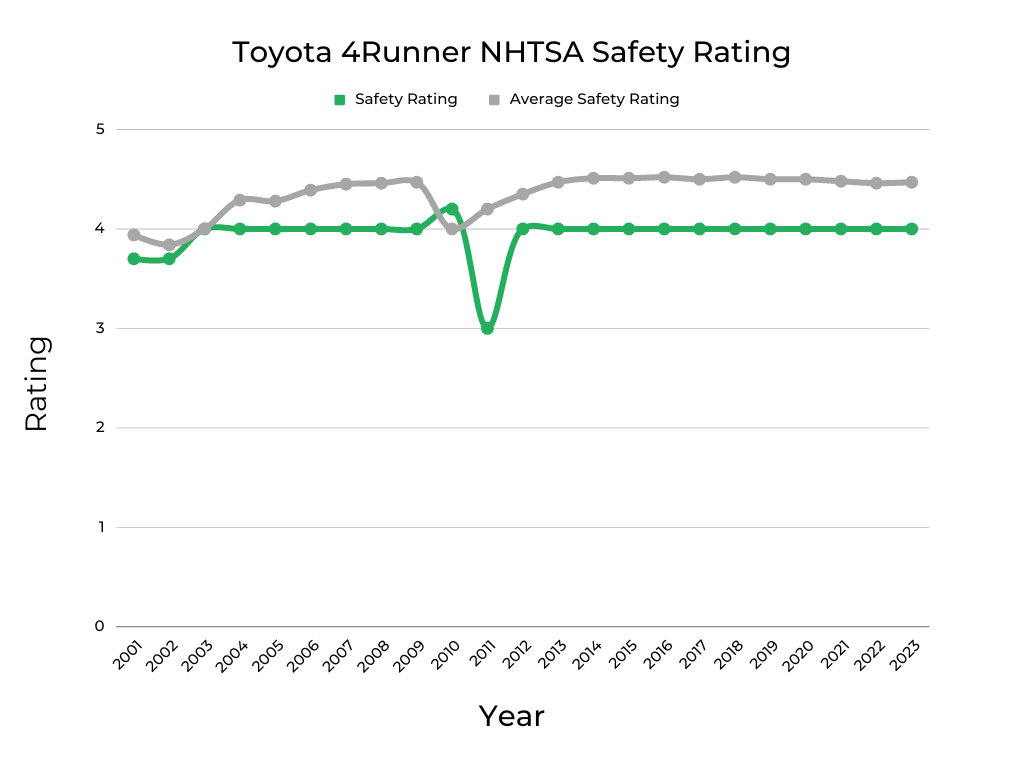
As you can see on the chart above, the Toyota 4Runner (green line) generally underperforms the auto industry average (gray line) when it comes to safety, though it still hovers around 4/5 on average. That is partly due to the increased risk of rollover inherent in any taller vehicle like the 4Runner versus a Toyota Camry, for example.
The notable dip in 2011 is a result of the NHTSA modifying its testing protocol that year to be more strenuous. It had a significant impact on the 4Runner’s safety score that year, which Toyota quickly corrected. Both the gray line – average crash test safety rating across the industry – and the green line – 4Runner safety ratings – illustrate published NHTSA data.
Understanding how a given model year of the 4Runner ranks for safety is important as it plays a big role in keeping insurance premiums down. If you live in one of the states listed below, we can show you the cheapest vehicles to insure in yours.
| What Used Cars Are the Cheapest To Insure In: |
| Ohio |
| North Carolina |
| Michigan |
| Georgia |
| Texas |
| New York |
| Illinois |
| Pennsylvania |
| California |
MPG – Over The Years
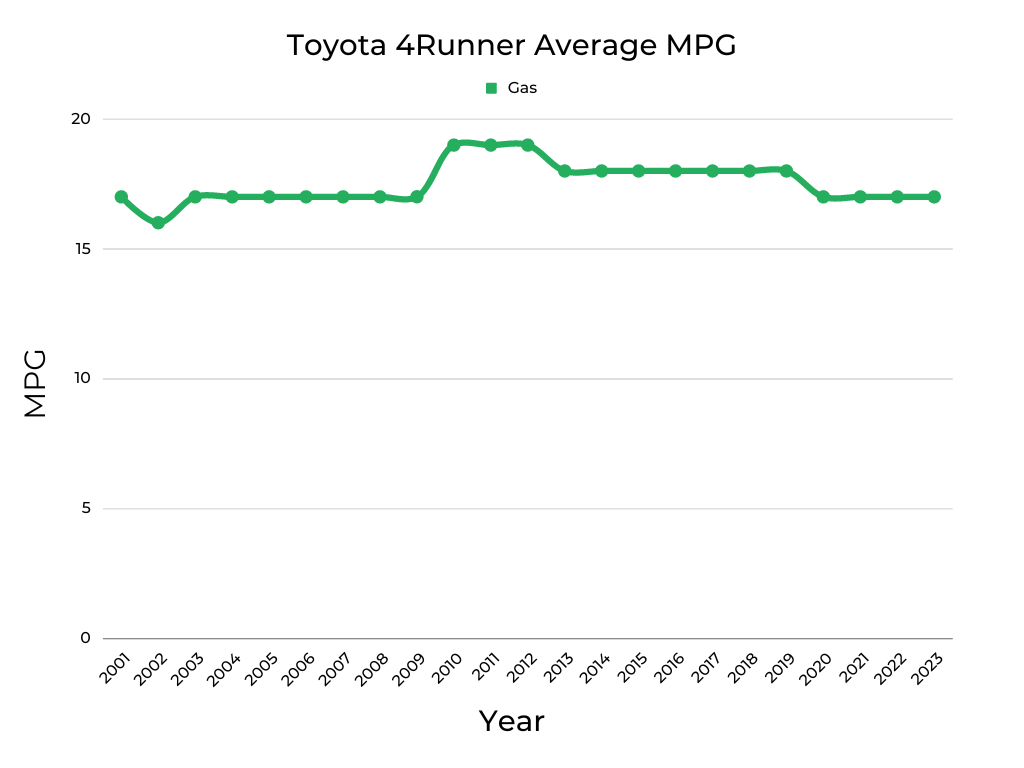
By averaging the combined fuel economy figures – from fueleconomy.gov – across all trims of each model year, we can create the above Toyota 4Runner Average MPG chart. Normally, vehicles become more fuel-efficient over time as powertrain technology improves to counter the inevitable creep in curb weight.
However, the 4Runner bucks that trend by fitting a thirsty V6, that hasn’t changed much in 20 years. To wit, the 2021 4Runner is upwards of 1,000 pounds heavier than a 2001 model. So, fuel efficiency is not, and mostly never has been, a selling point for the 4Runner.
Current Market Value of All Toyota 4Runner Years & Cost Per Year to Repair and Maintain Each

This chart plots current Toyota 4Runner market values from KBB against annual maintenance costs per owner surveys. It’s a valuable set of data points in defining why some model years are best avoided. For example, values flatten out from 2005 to 2006, which is one reason these 4Runners are on our list of models to avoid (more on this later)
If you’d like to learn about this vehicle’s past depreciation rate & our projected depreciation rate based on that, check out: Toyota 4Runner | Depreciation Rate & Curve Graphed.
When shopping for a used Toyota 4Runner it’s important to keep in mind that not all vehicles are cared for equally. To protect yourself from lemons, take along a FIXD Sensor on your test drive. FIXD connects to a free app on your smartphone to tell you more about the vehicle you’re checking out, including check engine lights and other hidden issues that the owner or dealership may be attempting to hide. Click here to learn more and get FIXD for only $19.99 (regular price $59)!
Important Features Timeline

The Best Years of the Toyota 4Runner
Taking into account FIXD and Owner reliability, government safety scores, fuel efficiency, and 4Runner owner survey responses, we’ve come up with this list of the best Toyota 4Runners. Pertinent recall information and notes about common DTCs are included as well.
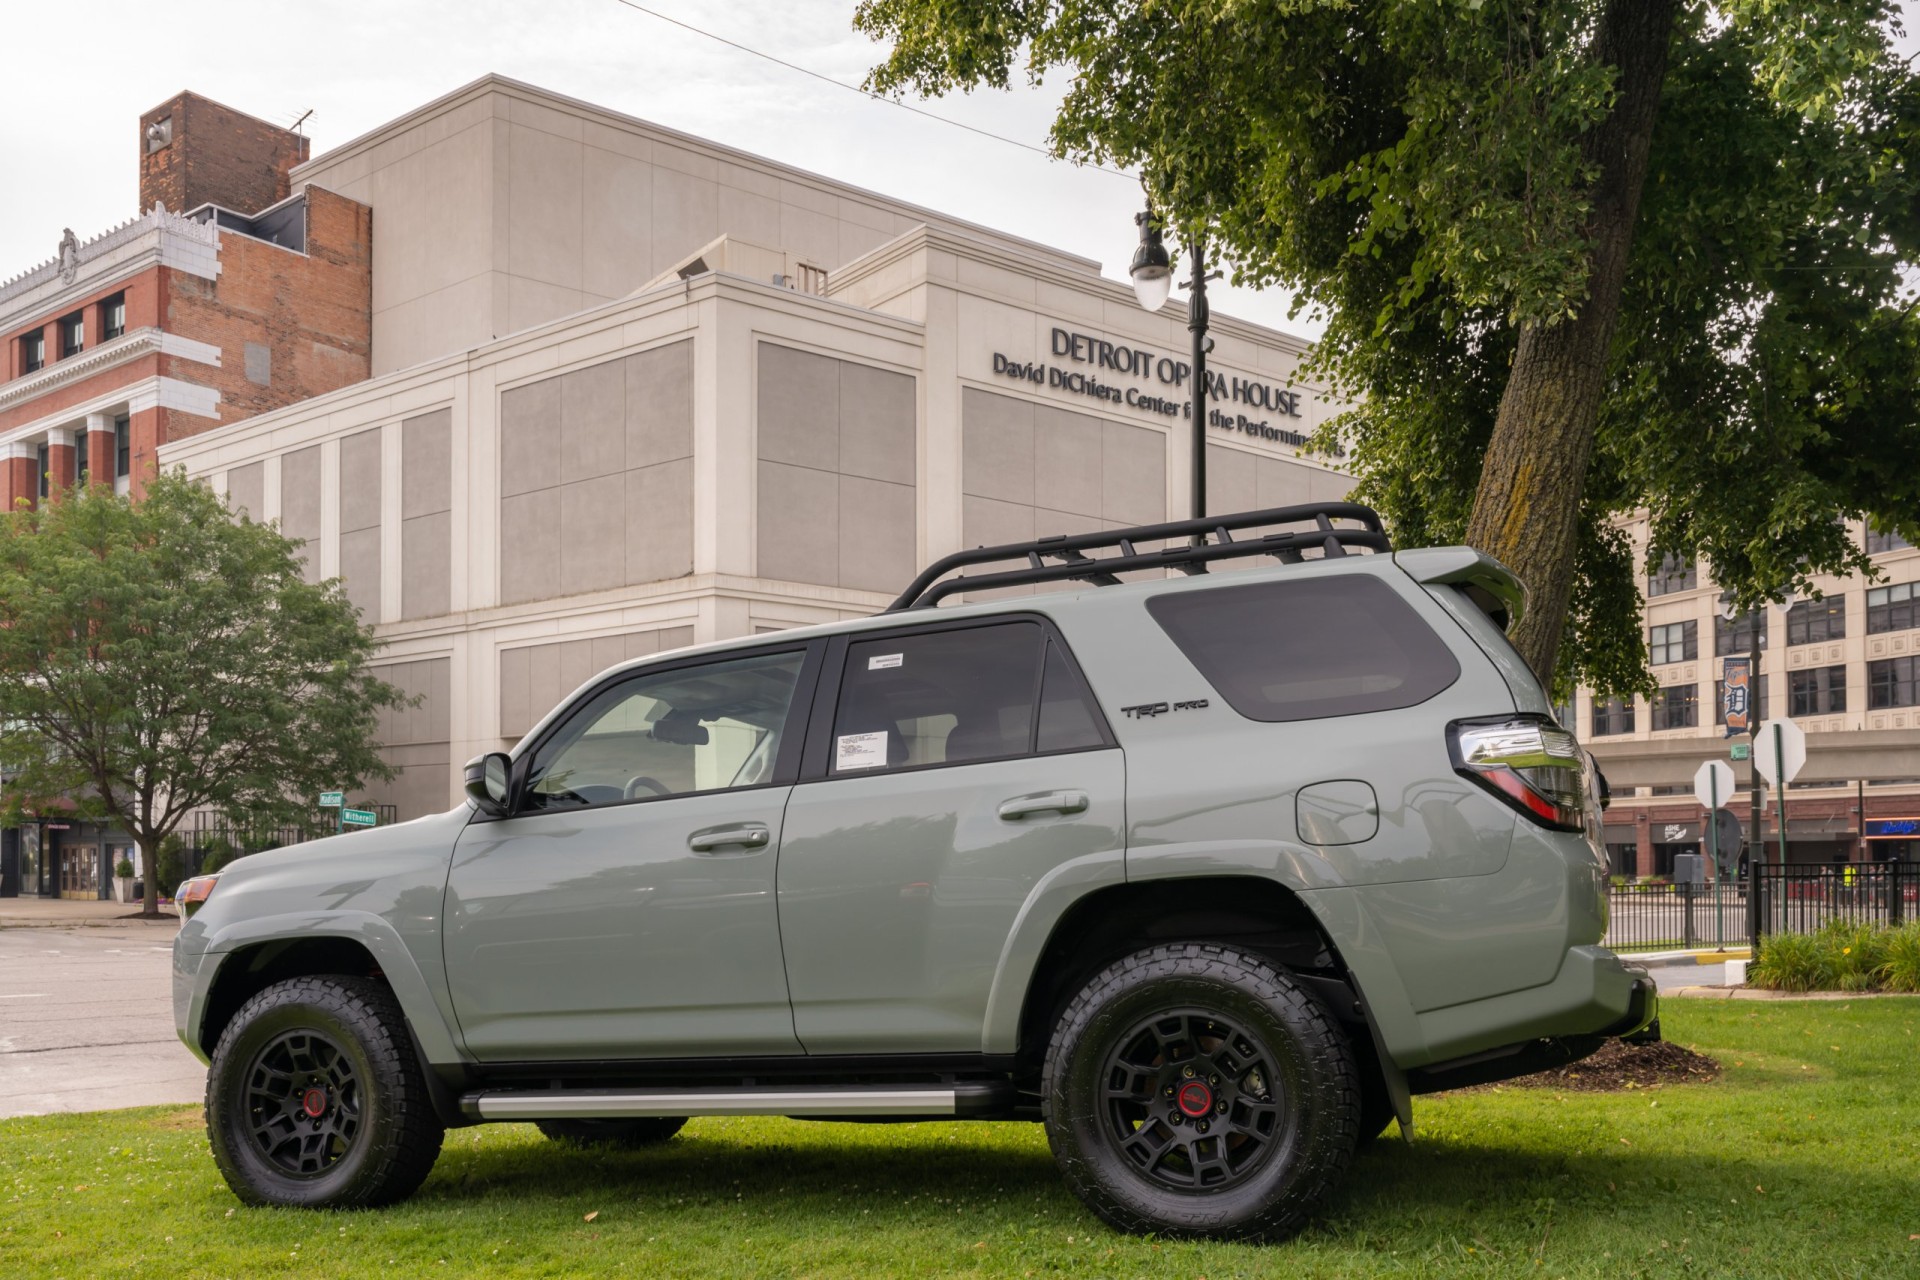
2020-2021 Toyota 4Runner

FIXD App Engine Reliability: 9-10/10
Owner-Reported Reliability: 10/10
KBB Value: $34,794-$34,720
Fuel Economy: 17 mpg
Annual Maintenance/Repair: $250-$500
Safety Rating: 4/5
Between the low odometer readings – less than 50,000 miles – and young model years, it’s not surprising that the 2020 and 2021 Toyota 4Runner top our list of best model years. 2021 marks the only year both the FIXD Reliability and Owner Reliability Scores are aligned at 10/10. Not to mention that the FIXD metric jumped four points from 2019.
While there were no powertrain updates, average fuel economy does dip by one mpg into 2020, but given the relatively dismal efficiency of the 4Runner overall, this isn’t likely to bother potential buyers all that much.
Annual maintenance costs drop to all-time lows in 2021 and interestingly, the Kelley Blue Book values flatten out during this period. This latter aspect could simply be a normalization of used 4Runner pricing as it is historically a sought-after vehicle and the used market on the whole has been running hot for the past few years.
Owner surveys paint a picture of rose-colored sentiment as 40% expect their 4Runner to hit 200,000 miles even though current odometer readings are far below that. Most are happy with the seat comfort but many agree that the 2020 entertainment system is hard to use. A new Entune setup debuted that year, so it might take some getting used to.
Another notable point here is that 40% of 2020 4Runner owners use their SUV primarily as a family vehicle. This is well above average and correlates with Toyota adding a host of standard features in 2020 that families would appreciate like a standard suite of advanced safety nets, dual rear USB ports, a Wi-Fi hotspot, and a safety telematics system.
You can expect less than a day per year in the shop for the 2020-2021 4Runners, but when it is time for repair work, watch out for DTC P0441. This issue with purge flow of the Evaporative Emission Control (EVAP) system could be just a loose gas cap or require a new purge valve.
Another common cause of CELs is DTC P0301. This severe issue means a misfire has been detected and it may be time to replace the spark plugs – we explain this in our DTC P0301 video. If DTC P0174 pops, it means the air-fuel ratio is out of balance and it may be time for a new Mass Airflow sensor.
Just one recall was issued for both the 2020 and 2021 4Runner. It was for a load capacity label displaying the wrong figures and affected fewer than 300 4Runners. A Toyota dealership should repair, at no charge, any safety recall on a 4Runner up to 15 years old.
2017-2018 Toyota 4Runner

FIXD App Engine Reliability: 7-8/10
Owner-Reported Reliability: 7-10/10
KBB Value: $28,497-$29,808
Fuel Economy: 18 mpg
Annual Maintenance/Repair: $250-$833
Safety Rating: 4/5
There’s no ignoring the massive 6-point improvement in the FIXD Reliability Score between 2016 and 2017 followed by another point in 2018. The subjective owner score did drop briefly, before moving back up to 10, a score frequently recorded over the past two decades.
Market values briefly dipped before heading back up in 2018 and annual maintenance costs are a mixed bag, but days spent in the shop each year are below average over this two-year stretch and 17% of owners say their 4Runner is cheap to repair which is twice the average for this metric
Between 40 and 57 percent of owners say they mainly use their 4Runner for travel and lots of driving. This is far higher than the average in this category and correlates with the 33% of 2017 owners who say the seats are comfortable.
One of the most common DTCs for these 4Runners, and Toyotas in general, is P1604. It is a fuel system-related issue that might mean it’s time for a new fuel pump which runs between $450 and $600 at a shop.
Both DTC P0441 and P0455 mean the EVAP system is malfunctioning, specifically the charcoal canister. Replacing this component, which absorbs and stores fuel vapors from the gas tank, should cost between $750 and $1,000.
The NHTSA issued five recalls for the 2017 4Runner with one for a TFORCE roof rack that can loosen and detach unexpectedly. Fortunately, it only impacted about 1,000 4Runners. There are also five recalls for the 2018 4Runner, including one for fuel pump failure that affected some 1.5 million vehicles.
2012-2015 Toyota 4Runner
FIXD App Engine Reliability: 8/10
Owner-Reported Reliability: 10/10
KBB Value: $14,452-$21,303
Fuel Economy: 18-19 mpg
Annual Maintenance/Repair: $500-$750
Safety Rating: 4/5
In 2011, Toyota dropped the short-lived four-cylinder engine option from the fifth-gen 4Runner lineup along with discontinuing the V8 a year earlier. This decrease in powertrain complexity could help explain the impressive increase in the FIXD Reliability Score in 2012. It doesn’t hurt that owners delivered perfect 10s in reliability four years in a row.
Another benefit to eliminating the V8 option is that the average 4Runner fuel economy hits a high of 19 mpg for several years including 2012. And for those looking to buy a used 4Runner, the 2013 model is the value sweet spot with 150,000 miles on average and a KBB value of $16,000.
Though 150,000 miles may sound high, owners of the 2013 4Runner, and every other year in this range, report above-average confidence of reaching 200,000 miles and beyond. As well, 20% of 2013 owners say their 4Runner is cheap to repair which is the highest figure in this category over a 20-year span.
As for CELs, DTC P1604 and P1605 are the most common culprits between 2012 and 2015. These similar codes can indicate the presence of low-quality fuel, a clogged fuel filter, or the need for a replacement fuel pump. The latter issue costs between $450 and $600 to have repaired at a shop.
Another frequently seen DTC is P0441. It means the charcoal canister is acting up, which could lead to a pricey repair. This correlates with the fuel system commonly being responsible for a $500+ repair on the 2013 4Runner according to owners, which is by far the highest percentage of any model year.
There were eight recalls for the 2012 4Runner and six for the 2013 model. In both of those years, there were three separate problems related to exploding airbag inflators that affected some three million vehicles. The 2014 4Runner had seven recalls, while the 2015 model saw nine. A fuel pump failure issue that impacted 1.8 million vehicles was common to both years.
2007-2008 Toyota 4Runner
FIXD App Engine Reliability: 5-6/10
Owner-Reported Reliability: 9-10/10
KBB Value: $7,927-$8,698
Fuel Economy: 17 mpg
Annual Maintenance/Repair: $925-$1,100
Safety Rating: 4/5
Dramatic dips followed by equally dramatic upswings in the FIXD Reliability Score are a common theme to the Toyota 4Runner. Such is the case between 2006 and 2007 when this score jumped four points and then one more into 2008. The internet rumor mill points to a head gasket problem around 2006, but there was no official Toyota service bulletin for this.
It’s worth noting, however, that DTC P0306 – which translates to an issue with the 4Runner head gasket – was recorded 27 times per year, on average, by FIXD devices. But in 2006, this code popped more than 90 times versus just 10 in 2007. Regardless of a potential design flaw, fewer head gasket issues mean better reliability.
Annual maintenance costs and time in the shop do run high for these 4Runners, but keep in mind they are both at least 15 years old and show average odometer readings of more than 190,000 miles. The good news is that market values moved up in 2008.
Two of the most common DTCs for these 4Runners are P0420 and P0430. Both indicate it’s time for a new catalytic converter, work that runs between $1,500 and $2,000. Our DTC P0420 guide sheds more light on what this issue entails and how to take the DIY approach.
If DTC P0456 shows up, it means there is a small leak in the EVAP system that can likely be cured by simply tightening the gas cap. We go into more detail about this with our DTC P0456 explainer video.
Five recalls were issued for both the 2007 and 2008 4Runner and of those, a problem with the gas pedal sticking in the open position was the most significant each year. It impacted around 1.3 million vehicles.
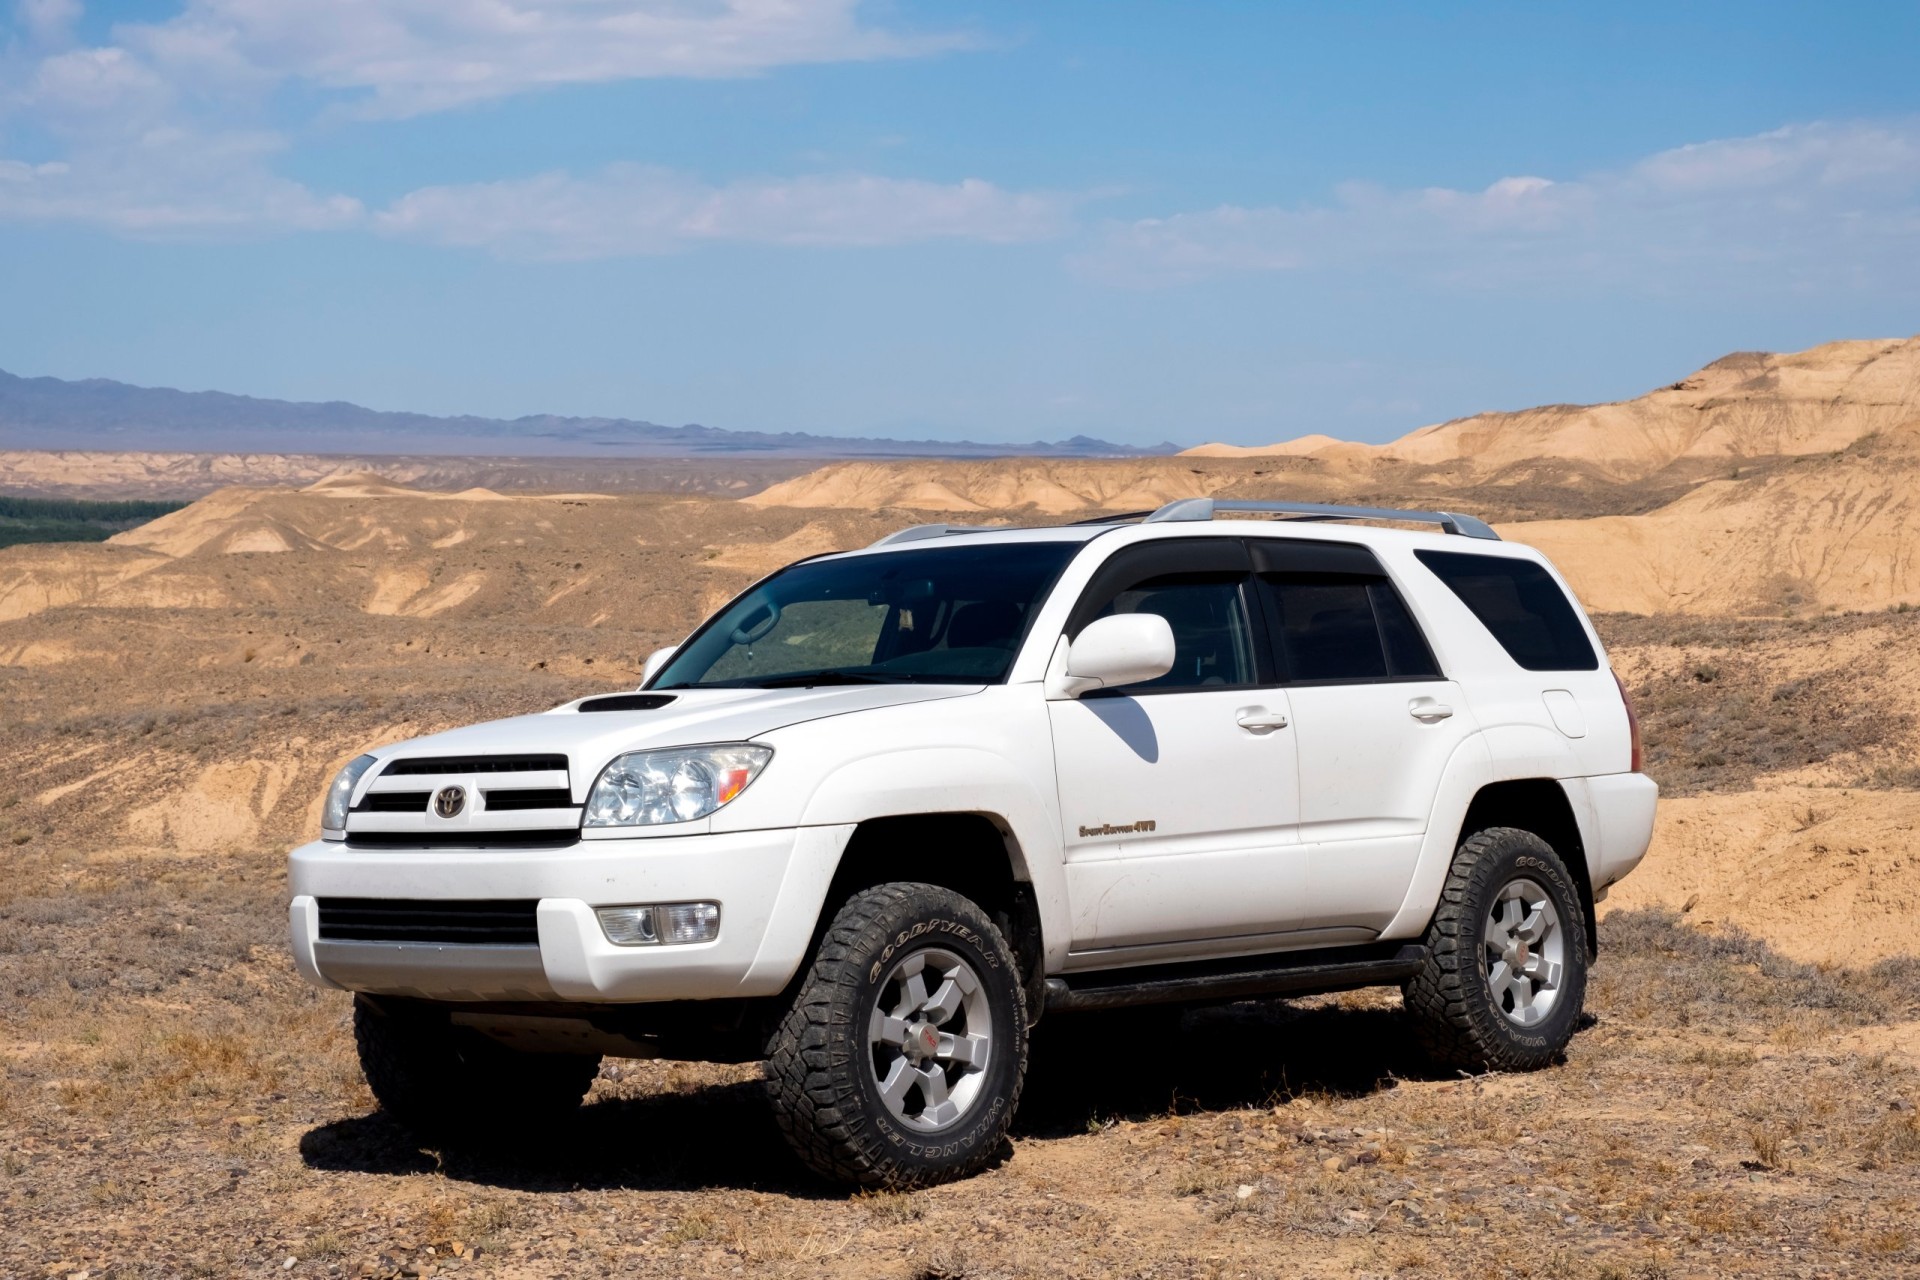
2003-2004 Toyota 4Runner
FIXD App Engine Reliability: 3-4/10
Owner-Reported Reliability: 8/10
KBB Value: $4,984-$5,511
Fuel Economy: 17 mpg
Annual Maintenance/Repair: $432-$729
Safety Rating: 4/5
Normally when a new vehicle generation debuts, it brings teething troubles, but that was not the case when the 4th-gen 4Runner arrived in 2003. Though the FIXD Reliability Score is relatively low, the 2003 figure is an improvement over 2002 and it continued to move up for 2004.
Other factors that put these older 4Runners on the list of best model years are the increase in market value, decrease in maintenance costs, and light recall count – just three in 2003 and two in 2004. Owners are not in love with the seats but a higher percentage than average say their 4Runner is cheap to repair.
That latter point would apply when DTC P0442 shows up as this EVAP system leak is likely caused by a loose gas cap. However, DTC P0420 and P0430 would not fit this mold as both indicate it’s time to replace the catalytic converter. Our DTC P0420 DIY guide can help in trimming the $1,500+ cost of having this work done at a shop.
The Worst Years of the Toyota 4Runner

Working with the same information to determine the best Toyota 4Runners, we’ve compiled the list of model years to avoid. You can expect more issues with reliability, higher maintenance bills, and in some cases lower safety ratings with these poor-performing 4Runners. We are starting from the absolute worst and progressing to the least worst.
2005-2006 Toyota 4Runner
FIXD App Engine Reliability: 1/10
Owner-Reported Reliability: 10/10
KBB Value: $7,408-$7,960
Fuel Economy: 17 mpg
Annual Maintenance/Repair: $563-$917
Safety Rating: 4/5
Halfway into 4th-gen production, Toyota added VVT to the V8 motor and swapped out the 4-speed automatic for a 5-speed unit on the V6 powertrain. It wreaked havoc on reliability and drove the 2005 and 2006 4Runner to all-time FIXD Reliability Score lows.
As noted in the 2007-2008 4Runner section above, there was a rumored head gasket problem that afflicted the 2006 4Runner. Though Toyota didn’t release any official bulletins around this, FIXD devices recorded DTC P0306 – which indicates a head gasket problem – 92 times in 2006 and 127 times in 2005 versus an average of just 27 across 20 years.
There are trouble codes that appear with more frequency than P0306, but the spike in this particular code over this span doesn’t help with reliability. Those more common codes are P0420, P0430, and P0456. The first two mean the catalytic converter is on its way out, while the latter means there is an EVAP system leak likely caused by a loose gas cap.
Speaking of reliability, there is a dramatic mismatch between the FIXD and owner-reported scores in 2005 and 2006. That’s because 76% of owners, across both model years, think their 4Runner can travel across the country without issue and the other 24% chose the next-best answer option that a 500-mile road trip would be a breeze. None of these owners think their 4Runner is only good for around-town jaunts.
The big “but” is that the 2005 4Runner kicked out more DTCs than any other model year and 2006 wasn’t far behind. In both cases, the DTC count is more than twice the average across 20 years. Point being, these 4Runners are objectively unreliable.
As for recalls, the NHTSA issued five each for the 2005 and 2006 4Runner. A pedal entrapment issue affecting over a million vehicles was the most impactful in 2005, while an issue with inadvertent side-curtain airbag deployment affected 320,000 vehicles in 2006.
2001-2002 Toyota 4Runner
FIXD App Engine Reliability: 2-3/10
Owner-Reported Reliability: 9-10/10
KBB Value: $4,386-$4,759
Fuel Economy: 16-17 mpg
Annual Maintenance/Repair: $350-$417
Safety Rating: 3.7/5
These old third-gen 4Runners are relatively cheap to repair and owners like them, but with a FIXD Reliability Score of just three in 2001 and two in 2002, we can’t recommend either. Granted, mileage for both model years is in the 200,000-mile neighborhood, but unfortunately, reliability shows a decline year-over-year.
A relatively high percentage of 2001 and 2002 owners think their 4Runner is a cheap date at the garage, but if the bill comes in high, don’t be surprised if it’s for the brakes. There is a 40% chance of an expensive repair being brake system-related, which is far higher than any other year. Expect to pay about $500 to have 4Runner brake pads and rotors replaced by a professional.
There is a theme with Toyota 4Runner diagnostic trouble codes that is spelled E-V-A-P and the 2001-2002 models stay true to form. DTC P0440 and P0446 are both EVAP system issues that mean the charcoal canister is on the fritz. DTC P0420, for the catalytic converter, costs up to $2,000 to have fixed as we look at in our DTC P0420 explainer video.
Of the three recalls issued for both the 2001 and 2002 4Runner, a problem with ball joint failure was common to both model years. It impacted nearly 800,000 vehicles.
2016 Toyota 4Runner

FIXD App Engine Reliability: 1/10
Owner-Reported Reliability: 8/10
KBB Value: $30,762
Fuel Economy: 18 mpg
Annual Maintenance/Repair: $750
Safety Rating: 4/5
When a vehicle registers a 1/10 for its FIXD Reliability, you can bet we won’t recommend it. Not only does the 2016 4Runner fall into this category, but it also posts a 2-point decline for the owner-reported reliability score which is relatively significant.
Market values spike strongly into 2016, which could be driven by the arrival of the highly desirable TRD Pro model a year before which also became the most expensive 4Runner trim line available.
Half of all 2016 4Runner owners report using their SUV primarily as a family vehicle. This is higher than the average of 34% for this metric and may have something to do with the 2014 mid-cycle refresh that brought family-friendly features like a backup camera, a larger infotainment touchscreen, and soft-touch door panels.
As with most 4Runners, trouble codes for the 2016 model are clustered around the fuel system. Both DTC P0441 and P0455 mean it’s time for a pricey – $750-$1,000 – new charcoal canister. DTC P1604 is common to the Toyota lineup and could be related to a clogged fuel filter or a malfunctioning fuel pump.
There were eight recalls issued by the NHTSA for the 2016 4Runner and two of them deal with exploding airbag inflators, an issue that affected two million vehicles.
2009-2011 Toyota 4Runner
FIXD App Engine Reliability: 3-5/10
Owner-Reported Reliability: 9-10/10
KBB Value: $9,980-$15,917
Fuel Economy: 17-19 mpg
Annual Maintenance/Repair: $250-$667
Safety Rating: 3-4.2/5
In 2010, Toyota launched the 5th-gen 4Runner with a new four-cylinder motor and a more powerful V6 fitted with an updated variable-valve timing (VVT) system. The FIXD Reliability Score had already dropped into 2009, a decline that continued through 2011. Even the perennially high Owner Reliability Score posted a minor drop during this stretch.
High points include better fuel economy, which can mostly be attributed to the thirsty V8 getting axed for the new generation and average-to-low maintenance costs. However, safety was dramatically worse in 2011 than any other year. This is attributed to the new NHTSA testing protocol that year, but the 4Runner fared especially poorly compared to the rest of the industry.
Owners responded favorably to the larger dimensions of the new 4Runner with more than 30% noting excellent driver visibility for the 2010 model. Owners of the 2011 4Runner were very impressed with the high-end amenities on offer like leather upholstery, dual-zone automatic climate control, and heated front seats as 50% report using theirs for luxurious driving.
All three of the most common DTCs during this period are fuel system-related. P1603 and P1604 mean the fuel filter is clogged or a new fuel pump is needed. DTC P0456, which indicates a leak in the EVAP system, can usually be fixed by tightening the gas cap.
Of the six recalls for the 2009 4Runner, one for damaged seat heater wiring that impacted 10,000 vehicles was the most significant. The 2010 model had the most safety recalls of any 4Runner at 12 with four of those being related to airbag issues, a problem that affected more than 4.5 million vehicles. Both of these recall issues were also at play within the list of 10 recalls for the 2011 4Runner.
2019 Toyota 4Runner
FIXD App Engine Reliability: 5/10
Owner-Reported Reliability: 10/10
KBB Value: $35,019
Fuel Economy: 18 mpg
Annual Maintenance/Repair: $417
Safety Rating: 4/5
Although Toyota didn’t modify the powertrain, a common reliability hurdle, the 2019 4Runner suffers a 3-point FIXD Reliability Score drop versus 2018. The Owner Reliability Score does remain perfect, which is why this model is the “best of the worst.”
That mismatch in reliability scores can be explained by analyzing the survey data. Every 2019 4Runner owner thinks their SUV can drive cross-country without issue – not one person felt differently. However, our objective FIXD data reveals a high count of trouble codes relative to how many miles these late-model 4Runners show.
This divergence is a prime example of how owner loyalty can cloud the objective reliability reality, which is why we publish both sets of data. That being said, 67% of owners say their 4Runner is expensive to repair, so perhaps that loyalty hasn’t completely clouded their judgment.
Two of the three most common DTCs for the 2019 4Runner are related to the EVAP system. DTC P0441 means the purge valve flow is incorrect and P0455 means there is a leak in the system. Fortunately, both can typically be corrected by tightening the gas cap. If DTC P2121 arises, look for an issue with the throttle position sensor.
The NHTSA issued four recalls for the 2019 4Runner with a suddenly failing fuel pump being the most significant. It affected some 1.5 million vehicles.
FAQs
What years of the Toyota 4Runner have engine and/or transmission problems?
The 2002 and 2006 Toyota 4Runner should be avoided for a variety of reasons noted above including a high likelihood of engine issues. The 2002 model has a 40% chance of an expensive repair being engine-related, while the 2005 4Runner comes in at 33% for this metric.
As for transmission trouble, the 2005 4Runner has a 22% chance of a $500+ repair involving this critical system, which is 11 times higher than the average for this category. It correlates with Toyota swapping the 4-speed automatic for a new 5-speed unit that year and speaks to the benefits of staying on top of automatic transmission service.
What is considered high mileage for a Toyota 4Runner?
Across 21 years of FIXD data, the 4Runner averages 140,000 miles. Two model years have average odometer readings beyond 200,000 miles including 215,000 in 2001. And four model years are at or beyond 190,000 miles.
When you couple that with 27% of owners expecting their 4Runner to hit at least 200,000 miles, it’s reasonable to say 165,000 miles is considered high mileage for a Toyota 4Runner. That may leave you as much as 50,000 miles to run up on the odometer before the engine does its swan song. Keep in mind that the year of the 4Runner you buy may determine whether you can afford to drive it those extra miles.
What other vehicles should I consider?
There are few SUVs left that directly compete with the 4Runner’s off-road-focused style, but the Jeep Wrangler is certainly one of them. Jeep’s Grand Cherokee is perhaps an even closer competitor given the doors and roof don’t come off.
Leaning more crossover than off-roader, the Ford Explorer and Honda Pilot do offer a modicum of rough road capability with a higher degree of creature comforts. No matter which path you choose, be sure to read up on best practices for treading lightly off-road before your next adventure.
What owners of the Toyota 4Runner like to use their car for:
| Frequent Use Categories: | How Useful? (Out of 5 Stars) |
| Family Vehicle | **** |
| Lots of Driving (travel/long commute) | *** |
| Hauling/Towing | * |
| Office on Wheels | * |
| Sport/Fast Driving | * |
| Luxurious Driving | * |
| Outdoor/Off-Road | ** |
A Note About Data and Information Sources
This article has many details about Toyota 4Runner reliability; here’s what we used for our assumptions and recommendations.
- FIXD Reliability Score & Data: Engine reliability information is captured via the FIXD App.
The FIXD Reliability Score is calculated using the number of DTCs per year, weighted by mileage. This is then turned into a scale of 1-10 for easy graphing.
This is an objective score.
- Owner Reliability Score & Data: This data is the result of surveying Toyota 4Runner owners who use FIXD.
The Owner Reliability Score comes straight from owners of the Toyota 4Runner.
This is a subjective score.
To determine the Owner Reliability Score we ask each car owner:
How reliable would you say your Toyota 4Runner is?
a. Just point A to point B driving
b. A Daily Commuter
c. Good for a 100-mile road trip
d. Good for a 500-mile road trip
e. I could take a cross-country road trip, no problem
From here we translate their answers into the Owner Reliability Score:
a. = 2
b. = 4
c. = 6
d. = 8
e. = 10
Keep in mind, owners may think their car is more or less reliable than it actually is.
One potential problem is that people often buy the same make or model they are used to when they go car shopping, just a newer year.
Ford, for instance, has a number of consumer loyalty awards for the Ford F-Series, Ford Mustang, and Ford Expedition.
Car owners may be so loyal to the make or model they currently own that they would have trouble accurately comparing their cars’ reliability to others.
It’s for this reason that we ask car owners a question that is relative to mileage rather than relative to other cars.
Still, be mindful of the accuracy of these Owner Reliability Scores, people’s perceptions and unconscious blindspots can skew data.
We suggest looking at both the FIXD Reliability Score and the Owner Reliability Score for this reason.
- KBB Value: Average private-seller valuations as supplied by Kelley Blue Book (KBB), based on a Toyota 4Runner with typical mileage for that respective model year.
- Fuel Economy: Mileage-per-gallon estimates according to the EPA MPG on Fueleconomy.gov
- Annual Maintenance/Repair: Upkeep expenses as reported by surveyed Toyota 4Runner owners
- Safety Rating: Crash test data collected and reported by NHTSA. We average all ratings for each year to come up with a simplified, average safety score. This makes it easier to look at on a graph.
References
- Toyota 4Runner model-specific information. Retrieved June 20, 2023, from https://www.edmunds.com/
- Toyota 4Runner model-specific recall information. Retrieved June 20, 2023, from https://www.nhtsa.gov/recalls
- Toyota 4Runner model-specific information. Retrieved June 20, 2023, from https://www.auto-brochures.com
- Toyota 4Runner model-specific information. Retrieved June 20, 2023, from https://pressroom.toyota.com/

Niel Stender grew up doing replacement work on his old Cherokee and sweet Mitsubishi Starion, which led to a degree in mechanical engineering and a job at Ford as a vehicle dynamics engineer. His writing infuses that automotive background with sales and marketing experience. Writing about cars for close to a decade now, he enjoys digging into some of the more technical mechanical systems under the hood and throughout a vehicle.