
With new car prices higher than ever, the used market is a great place to shop and if you’re looking for a midsize sedan, the Volkswagen Jetta and Toyota Camry are two excellent options. Both have been on sale for at least 40 years and, like any vehicle, some model years are better than others.
This is why we’ve put together this comprehensive comparison of the Jetta and Camry that covers the 2001 through 2021 models. You can read on for more details, but the table below is a good place to start as it provides a quick breakdown of your best bet based on budget and reliability.
| Income Bracket | Monthly Financing Cost Range | Cash Purchase Price Range | Volkswagen Jetta Years | Toyota Camry Years | Best Model Year: | Why? |
| < $5k | $42 – $83 | $1,500-$3,000 | N/A | N/A | N/A | There are no “best of” options at this price point for either car |
| $5k-$10k | $83 – $125 | $3,000-$4,500 | 2001-2013 | N/A | 2013 Jetta | All Camrys in this price range fall into our “worst of” category |
| $10k-$15k | $125 – $187 | $4,500-$6,750 | 2014-2015 | 2008-2009 | 2015 Jetta | The Jetta’s FIXD rating is 3 points higher than the Camry |
| $15k-$25k | $187 – $312 | $6,750-$11,250 | 2016-2018 | 2012-2016 | 2017 Jetta | Perfect 10 FIXD Reliability Score |
| $25k-$35k | $312 – $437 | $11,250-$15,750 | 2019-2020 | 2017-2018 | 2020 Jetta | Both cars have good reliability, but the Jetta does better |
| $35k-$50k | $437 – $625 | $15,750-$22,500 | 2021 | 2019-2020 | 2020 Camry | Perfect FIXD score and safety rating |
| $50k-$74k | $625 – $925 | $22,500-$33,300 | N/A | 2021 | 2021 Camry | Only used Camrys fit this price bracket |
See the methodology for the table above.
Talk about sedan stalwarts. The Volkswagen Jetta has been on sale stateside since 1980 with the Toyota Camry right behind it in 1982. All of this makes me feel suddenly old as I was born the same year the Jetta debuted. Anyway, the point is, that these cars are popular choices, particularly these days as sedans wither under the all-powerful SUV.
The Toyota Camry was the number one selling non-SUV in 2023 and the number seven vehicle overall. It enjoys a reputation for reliability and resale value plus a push away from boring beige blandness with the current generation.
Over at Veedub, the Jetta remains true to its enthusiast-friendly form by continuing to come standard with a manual transmission. Like Toyota, Volkswagen’s are generally perceived as well-built thanks to the German automaker’s reputation for exacting standards.
However, no cars are perfect, which is why we’ve put this comparison together. It’s based on the best and worst model year rankings that we have for the Jetta and Camry individually.
We’ve then analyzed those rankings collectively to help you figure out which model year of which car is the best bet according to reliability, National Highway Traffic Safety Administration (NHTSA) crash-test scores, current market values per Kelley Blue Book (KBB), fuel economy figures from FuelEconomy.gov, and how much owners pay annually to keep their Jetta or Camry on the road.
Of course, budget is a priority as well, which is where the above table comes in. It only lists model years that made the “best of” cut, which is then broken down by income range, financing costs, and current market values. The idea is to give buyers a place to start and on that note, be sure to check out our used car buying checklist before getting too far down the road.
If you’re looking to buy a new model, have a look at our 2023 comparison of the Volkswagen Jetta and Toyota Camry. Looking for even more car-buying insight? This list of articles includes the best and worst model year rankings of Jetta and Camry competitors along with relevant comparisons.
Price History Comparison | Volkswagen Jetta vs Toyota Camry
Average Market Value – Based on Owners’ Self-Reported Mileages | Volkswagen Jetta vs Toyota Camry
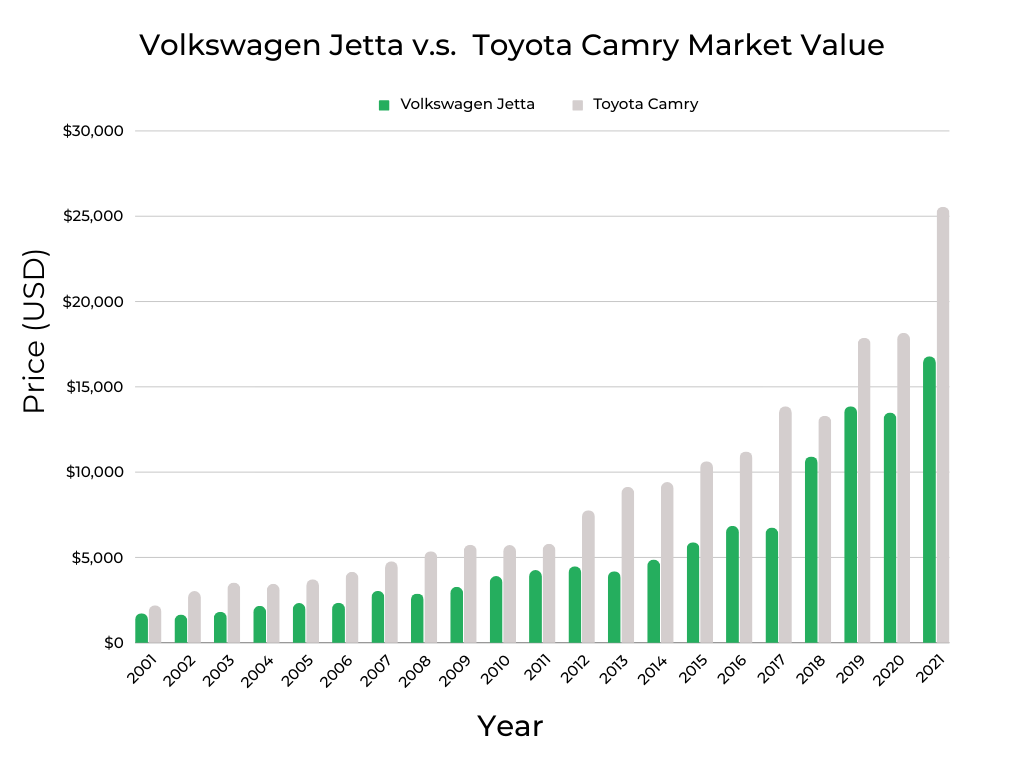
As I mentioned earlier, the Camry is known for having strong resale values and this is particularly evident against the Jetta. The chart above uses KBB data to show how much both of these cars cost at the moment and as you can see, the Camry is more expensive every single year from 2001 to 2021.
That follows suit with the Camry having a higher price tag than the Jetta for the past 20 years. In 2001, a base Camry was about $1,600 more than a base Jetta. As of 2021, the differential was closer to $6,000. So, yes, owners enjoy high resale values, but buyers need to make sure they’re not overspending when looking at these two cars.
Part of the gap can also be explained by odometer readings. For example, owners of 2013 Jettas report roughly 140,000 miles on the clock versus 110,000 from Camry owners. 30,000 miles has a definite impact on value as shown by the relatively large gap between these two vehicles in 2013 on the chart above.
Regarding the purchase price, this chart also illustrates how price generally trends down as the cars get older and accrue more mileage. And not all mileage is created equally. A high-mileage Jetta that was driven primarily on the highway may be more reliable than a low-mileage Camry used in stop-and-go local traffic.
We’ll go into more detail on the mileage topic below, but you can get a head start by looking at the best and worst model year rankings of the VW Jetta and Toyota Camry.
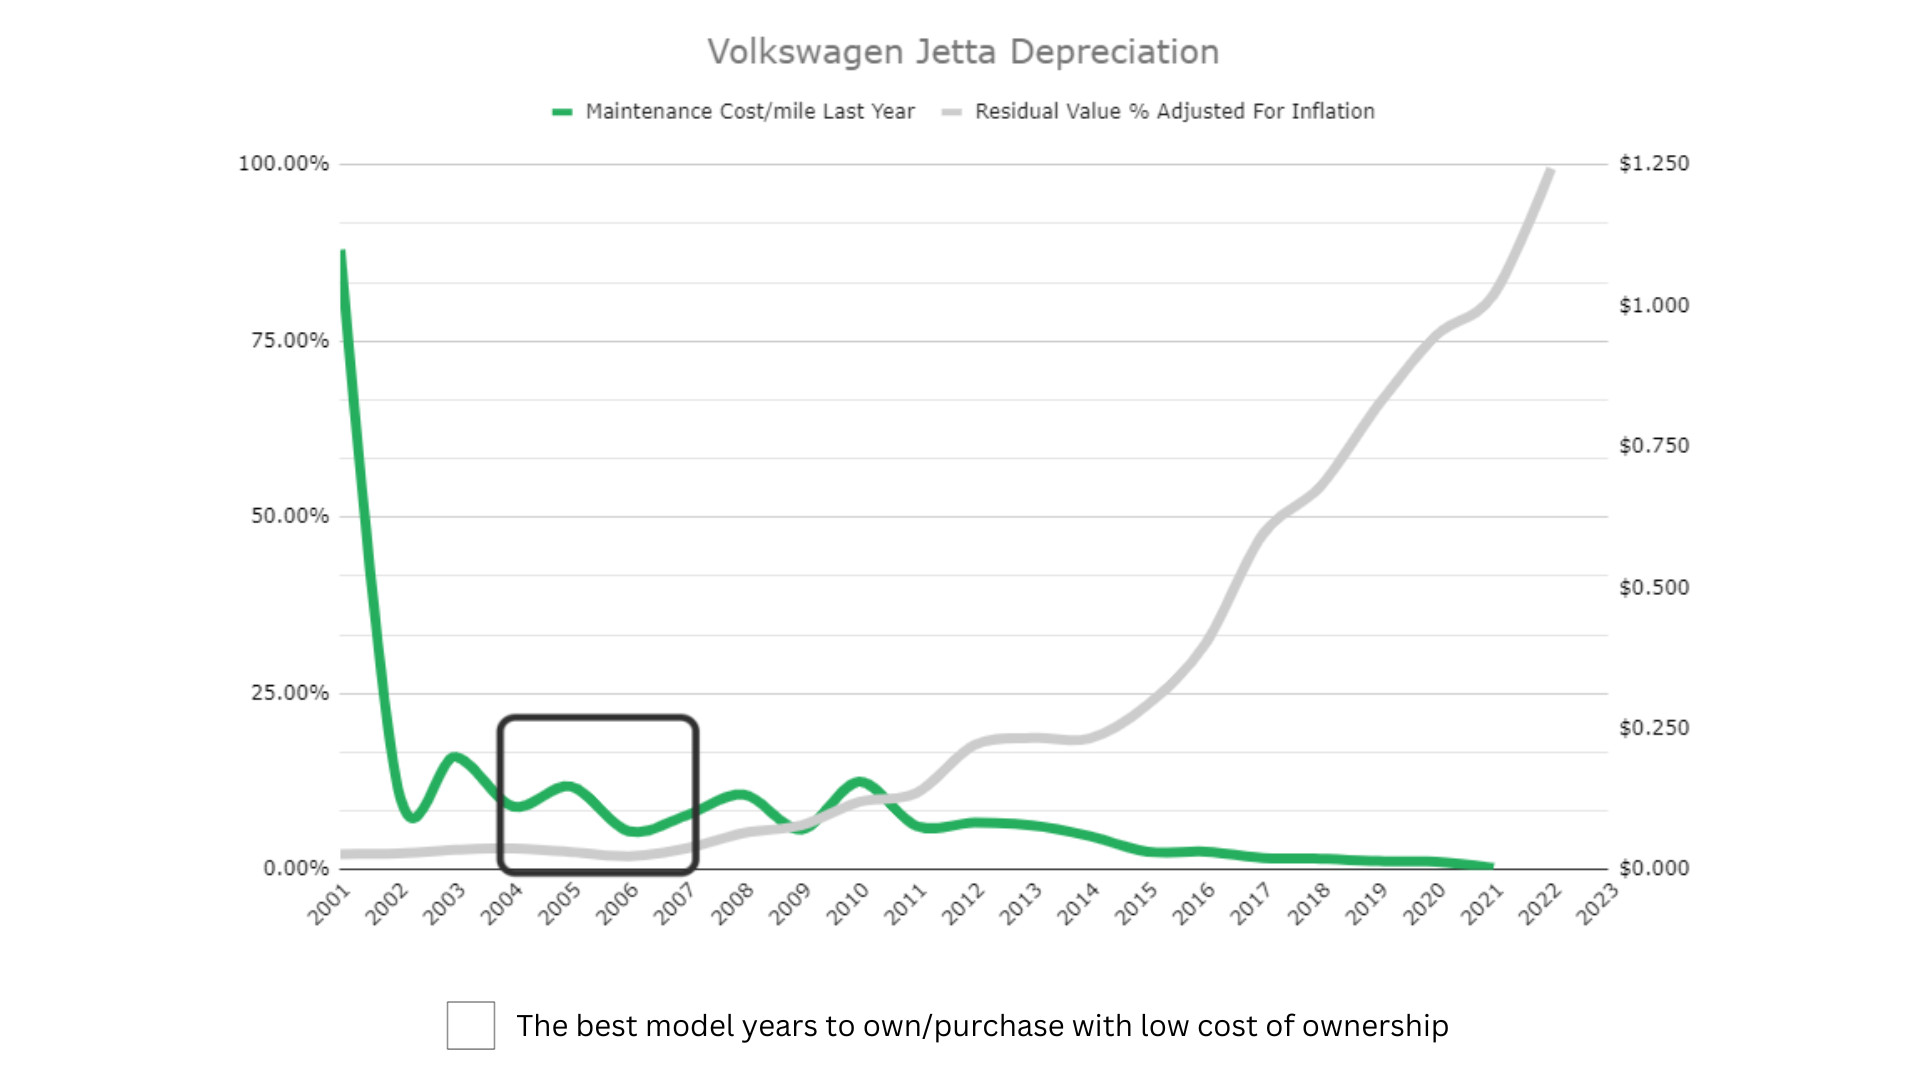
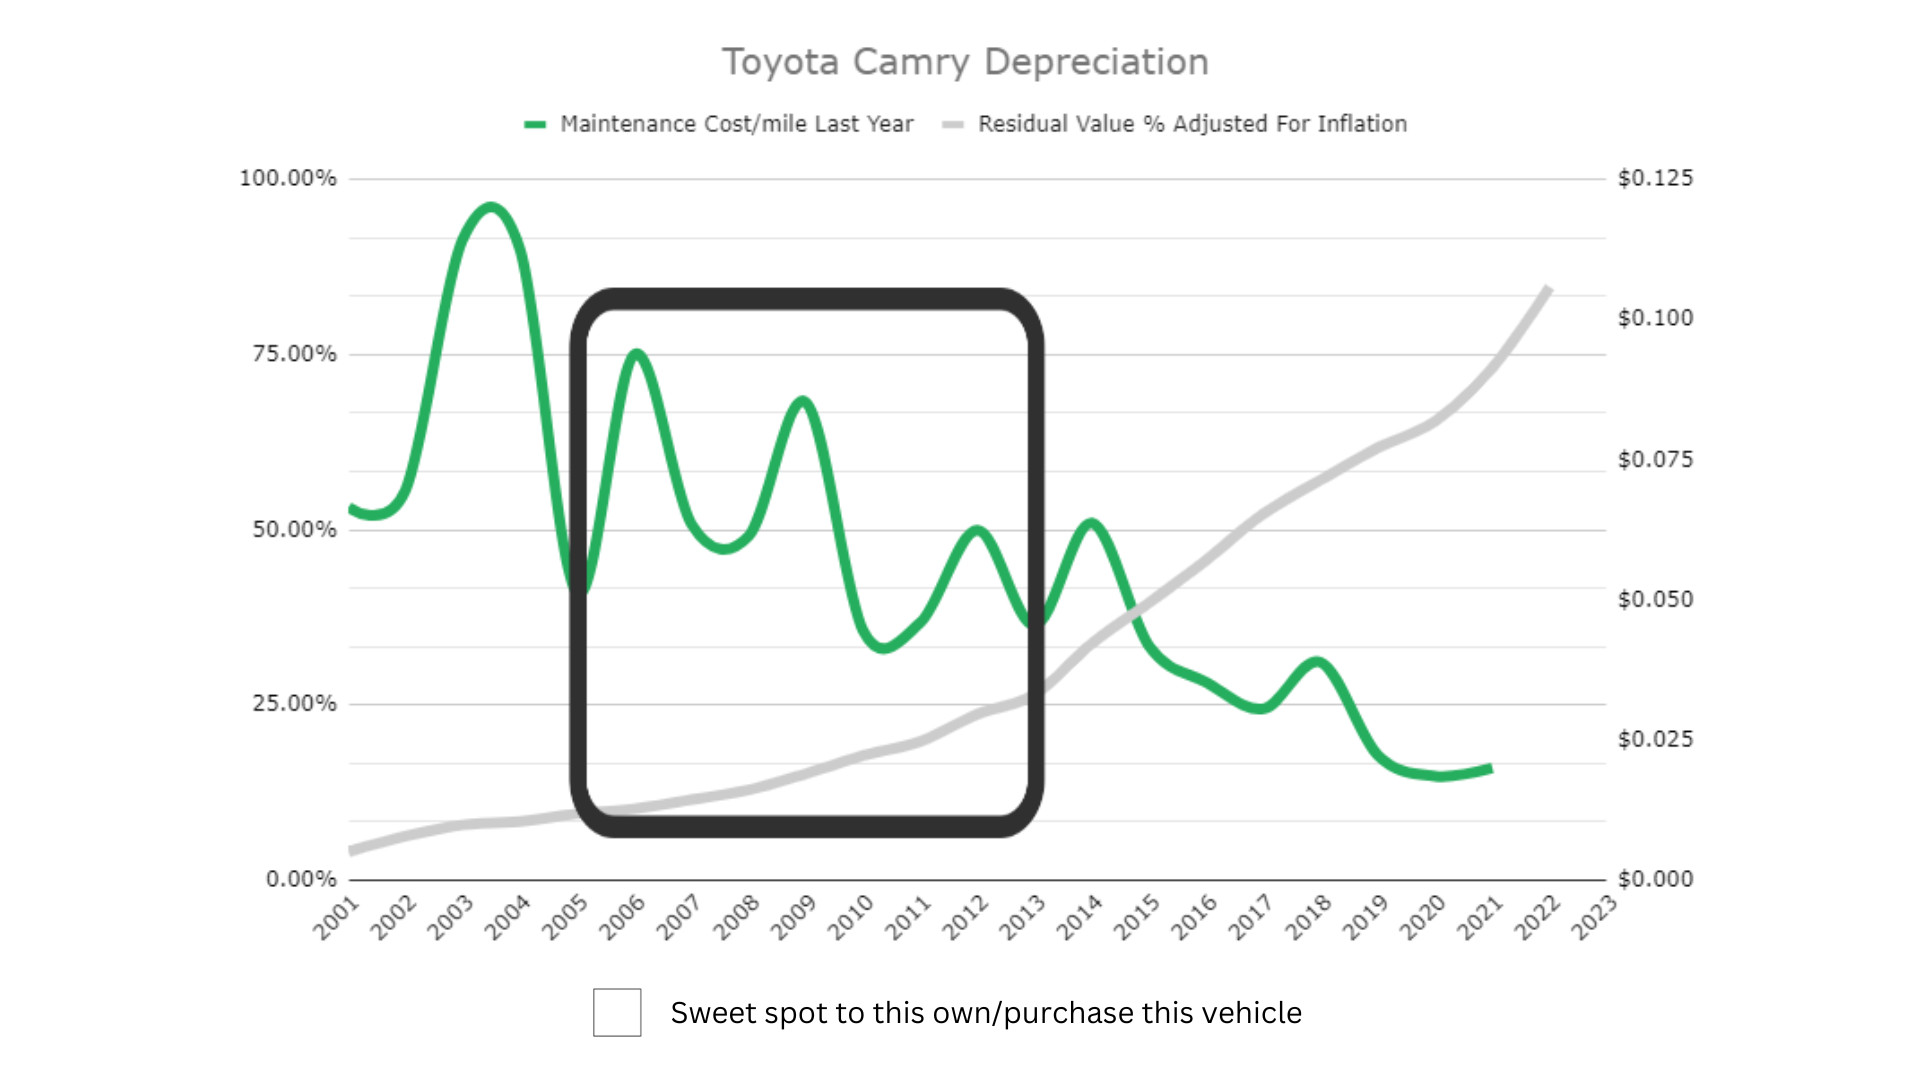
Depreciation vs Maintenance Expenses
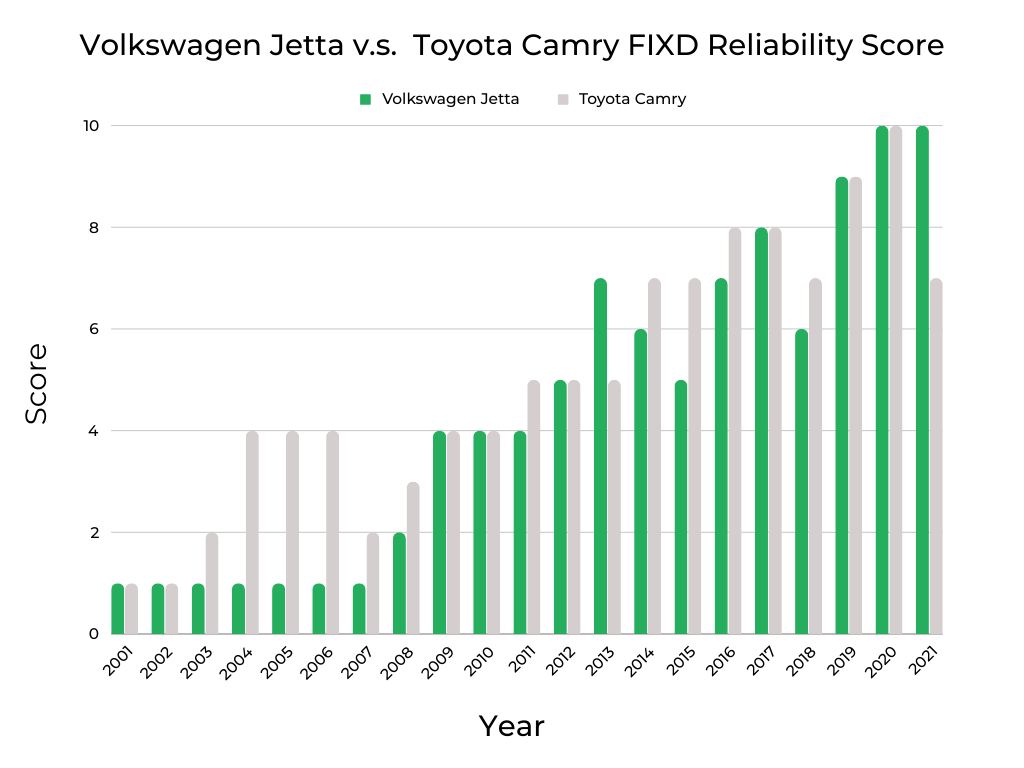
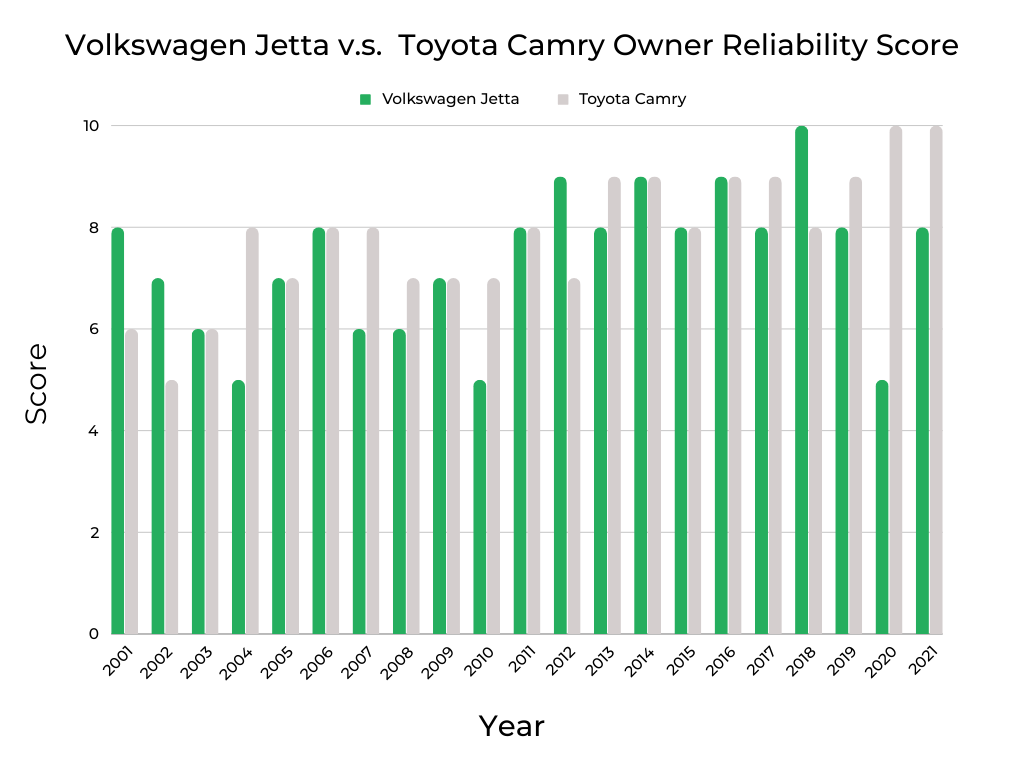
The charts above of objective FIXD reliability (left) and subjective owner-reported reliability (right) give credence to the commonly cited reliability of Toyotas. The FIXD chart is based on data collected by thousands of FIXD devices installed in customers’ Jettas and Camrys, while the owner-reported chart is based on how reliable those owners think their car is.
Looking at the FIXD graph, we can see that the Jetta and Camry have identical scores in 8 of the 21 model years shown. But the Camry beats the Jetta on this metric for 11 years, while the Jetta comes out ahead only twice. The theme continues with the subjective reliability chart as Camry owners feel their car is more reliable than the Jetta 9 of 21 years.
All that said, the Jetta is still a reliable car, but the Camry is even more so. Also, watch out for the 2004 through 2006 model years of both cars. On the FIXD chart, you can see the Toyota Camry rates far higher than the VW Jetta. However, all 3 of those years land on the “worst of” side of the Jetta and Camry model year rankings.
Longevity Comparison | Volkswagen Jetta vs Toyota Camry

The above chart shows how many miles you can expect to see on a given model year Jetta or Camry per owner survey responses. It’s intended to help you see where to shop based on what kind of mileage you’re comfortable with. Both the Volkswagen Jetta and Toyota Camry hit 100,000 miles with ease as recently as 2016.
As you would expect, the odometer readings climb as the cars get older and neither of these vehicles stands out as being notably more proficient at ratcheting up the miles. The Jetta is the only one to hit 200,000 miles, but 10 model years of the Camry have reached or passed the 150,000-mile mark.
None of this is surprising as “Lots of Driving” is one of the top usage categories reported by owners for the VW and Toyota. So, you can look over the best and worst model year rankings of the Jetta and Camry – which factors in fuel efficiency, safety, and repair costs – to find options that work for you and then compare them to this chart to find a car with the kind of mileage you’re comfortable with.
One caveat is the 2006 and 2007 Jetta. Looking at the above chart, you can see these two model years have impressively low odometer readings considering their age. But both fall into the “worst of” category per our rankings, so be careful here if you’re tempted by the low mileage.
Who Should Buy These Cars: The Legacy of The Volkswagen Jetta & Toyota Camry
| Frequent Use Categories: | Volkswagen Jetta | How Useful? (Out of 5 Stars) | Toyota Camry | How Useful? (Out of 5 Stars) |
| Family Vehicle | * * * * | * * * * * |
| Lots of Driving (travel/long commute) | * * * * * | * * * * |
| Hauling/Towing | * | * |
| Office on Wheels | * | * |
| Sport/Fast Driving | * | * |
| Luxurious Driving | * | * |
| Outdoor/Off-Road | * | * |
The table above ranks how owners primarily use their Jettas and Camrys. With its fuel-sipping ways and solid build quality, the “Lots of Driving” category is the most popular option for the Jetta. But the Camry leans further into family duty, which correlates with the high safety ratings it has earned over the years.
Though the rest of the usage categories all only register a single star, digging into the data reveals that 9% of Jetta owners, on average, use their VW for “Sport/Fast Driving”. That’s just shy of the 2-star rating and something to keep in mind while shopping. With its manual transmission availability and GLI performance variant, be careful you’re not buying a used Jetta off the local leadfoot.
Driver Experience | A Summary of The Top 10 Volkswagen Jetta vs Toyota Camry Reddit Posts:
The What Car Should I Buy Reddit is a great source of unvarnished perspectives from owners of Volkswagen Jettas and Toyota Camrys, making it an ideal spot to spend some time asking questions about these cars that are important to you.
To help speed up that process, we’ve done a bit of digging ourselves and the results are mostly in line with both perception and objective reality. By and large, both the Jetta and Camry are well-liked, but for different reasons.
A common theme from Camry owners is that it has a bigger cabin, holds its value better, and – in hybrid form – has tremendous fuel efficiency. Although we don’t include dimensions in this comparison, the rest of those perceptions are backed up by data in the charts above.
One user summed up the Camry’s reputation for reliability as “Never die, easy to repair”. That’s about as straight to the point as it gets.
Redditors who own Jettas regularly comment on the replacement parts being pricey and maintenance costs that seem high, all of which we know to be true from the data. They also point to the “drive experience” of the Jetta as being more exciting, particularly in GLI form. The manual transmission helps here.
As with so many of these question-and-answer sessions around which car to buy – Jetta or Camry – the best way to look at it is along the lines of this Redditor’s reply, “There are a lot of good sedans. That’s why you’re getting different answers. The right car is the one that works for you, whether it’s the best deal or the best combination of features…”
Year-by-Year Comparison | Volkswagen Jetta vs Toyota Camry
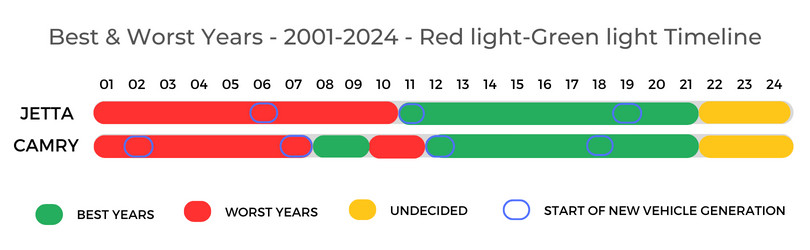
I keep mentioning our best and worst model year rankings series which includes the Volkswagen Jetta and Toyota Camry. The graphic above condenses all that information, from both articles, into a single, easy-to-digest format.
Model years in the red fall into the “worst” category, those in the green are from the “best” model years, and anything in yellow does not have enough data for us to make a clear call at this point.
If you were to overlay the depreciation sweet spots from earlier onto this graphic, you would see that the 2008, 2009, 2012, and 2013 Camrys are all in the ideal deprecation zone and from the “best of” side of the rankings. However, the 2004 to 2007 sweet spot Jettas are all in the red zone above, so watch out.
One other aspect of this timeline graphic is the blue circles. They mark the start of a new generation, a year that tends to be rife with reliability issues – across the industry – as automakers iron out unforeseen production kinks. You can see this at work with the 2006 Jetta and 2002 and 2007 Camry.
Important Features Timeline | Volkswagen Jetta vs Toyota Camry
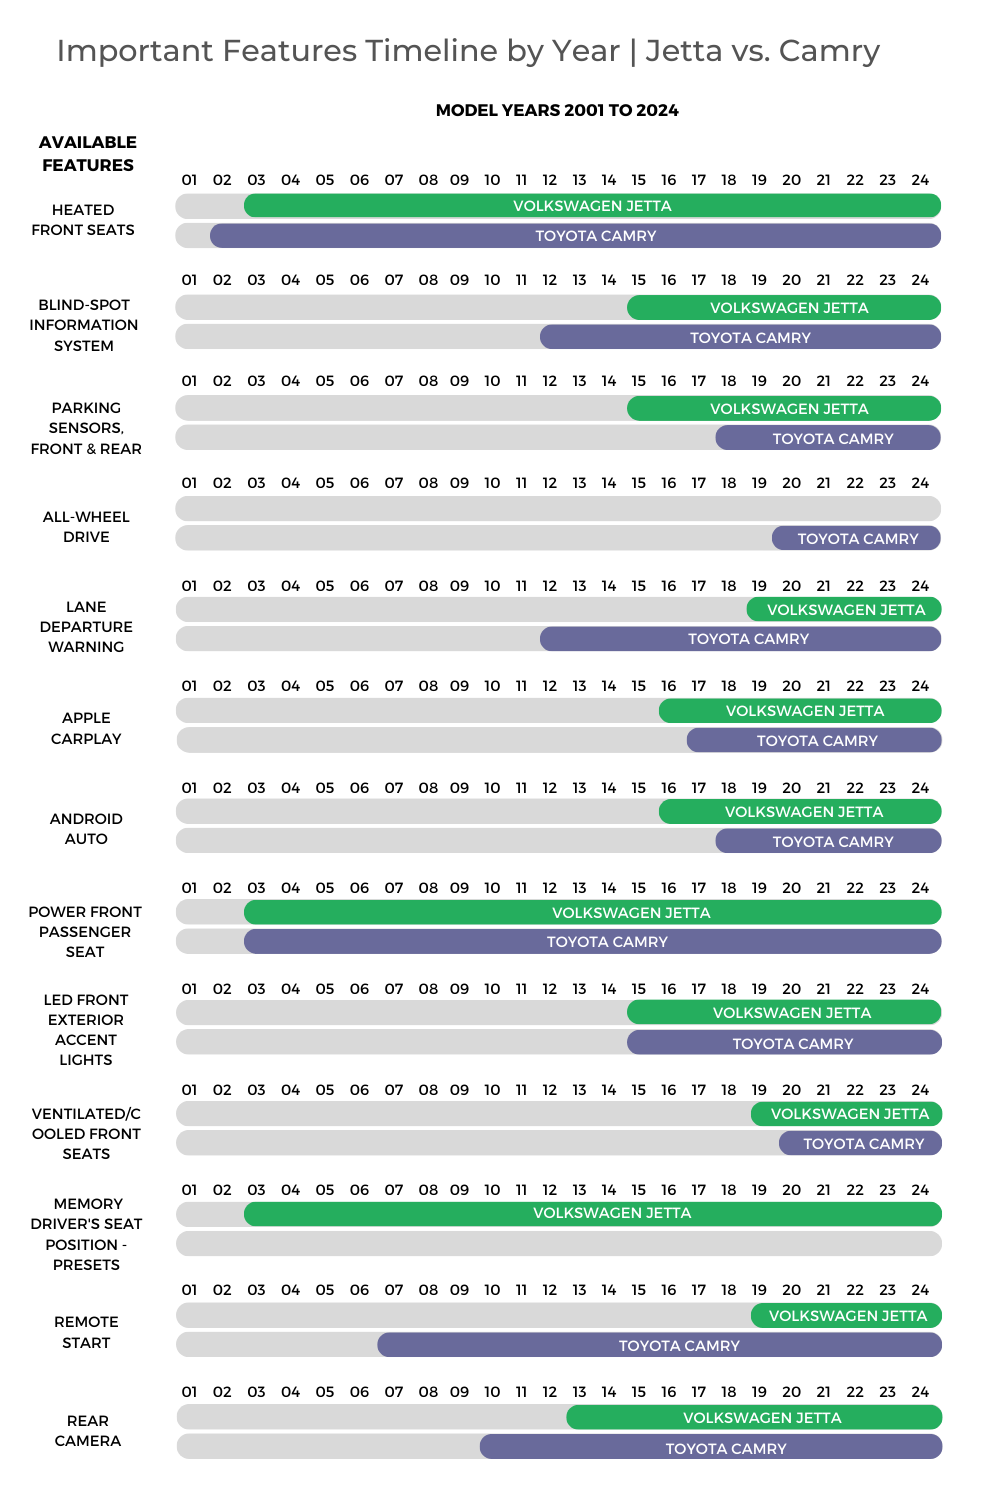
You can use the Features Timeline graphic above to get an idea of when the features you’re most interested in first showed up on the Jetta and Camry. In the creature comforts department, both of these cars have offered heated front seats for at least 20 years, but ventilated front seats only showed in the past 3 to 4 model years and only the Jetta can be fitted with driver-side memory settings.
Apple CarPlay and Android Auto are nearly universal on new cars these days, but before 2016, neither the Jetta nor the Camry offered these smartphone mirroring systems.
Advanced driver-assistance systems (ADAS) are also increasingly popular with VW’s IQ.Drive and Toyota’s Safety Sense suites of safety technologies adding more standard systems every year. But the Camry has been at the ADAS game longer by delivering blind-spot monitoring (BSM) and lane-departure warning (LDW) back in 2012. BSM didn’t show up on the Jetta until 2015 with LDW even further behind in 2019.
As for actually driving these sedans, enthusiasts know the Jetta has offered a manual transmission since day one. What you may not know is that the Camry could be had with a stick until 2011. It’s the other way around for hybrid powertrains, which have been available since 2007 in the Camry but only between 2013 and 2013 with the Jetta.
You can go deeper on the features rundown with our best and worst model year rankings of the Jetta and Camry.
Maintenance Costs (Year-by-Year Average) | Volkswagen Jetta vs Toyota Camry
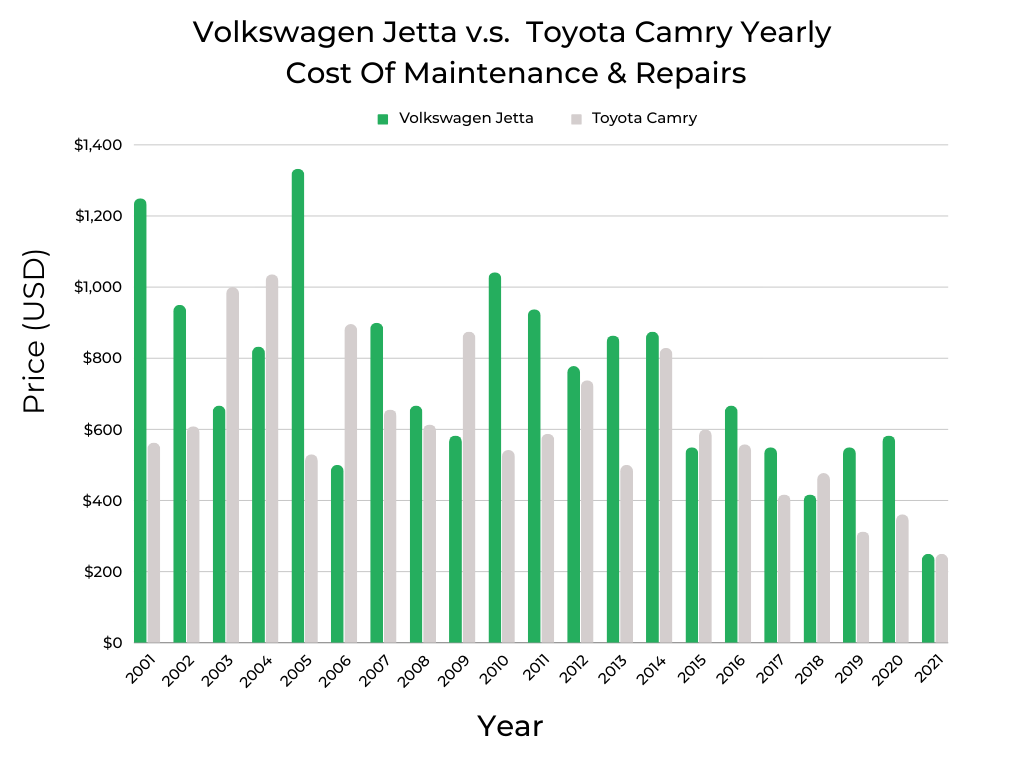
Another important factor when buying a used car is how much you should budget for maintenance and repair work. As you can see on the chart above, the Jetta lives up to its reputation for higher bills at the shop.
Per owner survey responses, the VW averages $749 in annual upkeep versus $591 for the Camry. That is borne out on the graph where we can see the Jetta “besting” the Camry 14 of the 21 model years shown. The 2001, 2005, and 2010 Jettas, which hit or exceeded $1,000, are also on the wrong side of the best and worst model year rankings.
In 2003 and 2004, the Camry also hovered around the $1,000 line, and like the Jetta, both of these model years are in the “worst of” model year rankings.
Typically, the older the car, the more you can expect to pay each year to keep it road-worthy as high miles generally translate to more wear and tear.
But keep in mind that a high-mileage vehicle with regular preventative maintenance may be in better shape than a low-mileage option with a spotty service history. In other words, do your homework on this point before making a purchase decision, this explanation on what is considered high mileage offers tips on this front.
Safety Rating Comparison | Volkswagen Jetta vs Toyota Camry
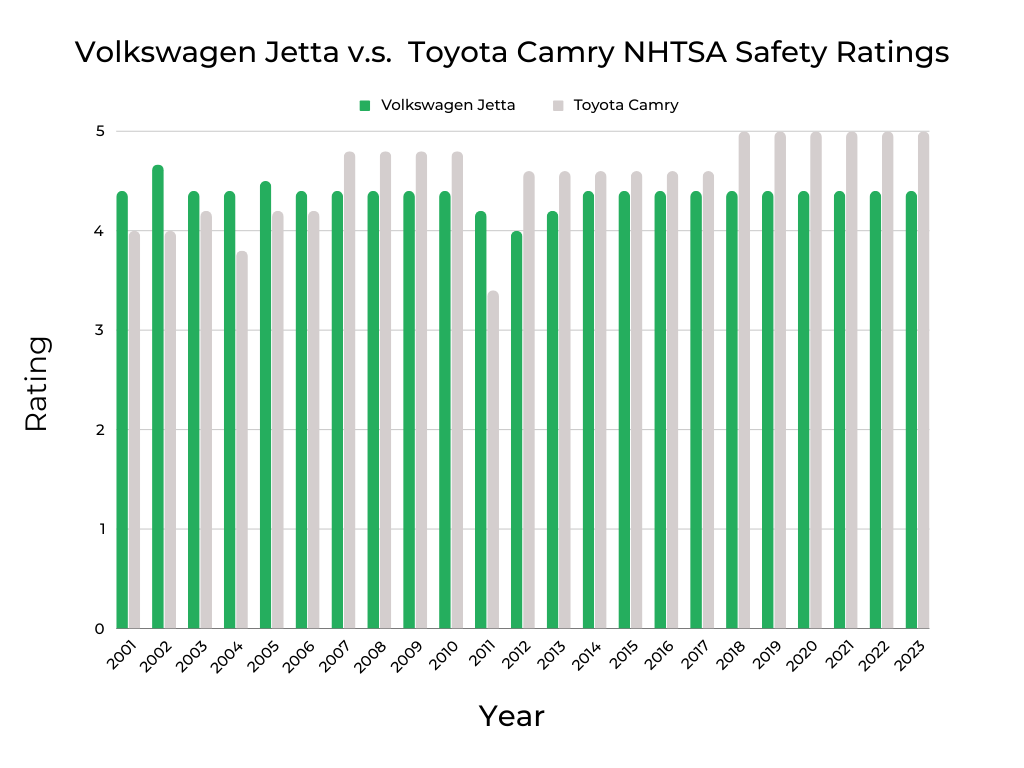
Looking over the above comparison of NHTSA safety ratings, buyers can rest easy knowing virtually any Jetta or Camry built between 2001 and 2023 is on the safe side. Both cars hit or exceed 4 out of 5 stars nearly every year with the Camry earning perfect scores since 2018.
The notable decline in 2011 can be attributed to the NHTSA rolling out more stringent crash-test protocols that year, which caught most of the automotive industry flat-footed. The Camry recovered quickly with the Jetta performing worse in 2012 before improving.
A common thread on these safety ratings is for a vehicle to post an improvement from one generation to the next. The Camry largely follows this trend as 2007, 2012, and 2018 all marked new generations and an associated increase in this metric. For no clear reason, the Jetta does not take this path, but it’s an objectively safe car nonetheless.
We go into more detail on each car’s safety scores over time in our model year rankings series for the Volkswagen Jetta and Toyota Camry. For more granular details on crash-test data, just plug in the year and model on the NHTSA ratings site.
Fuel Efficiency Comparison | Volkswagen Jetta vs Toyota Camry
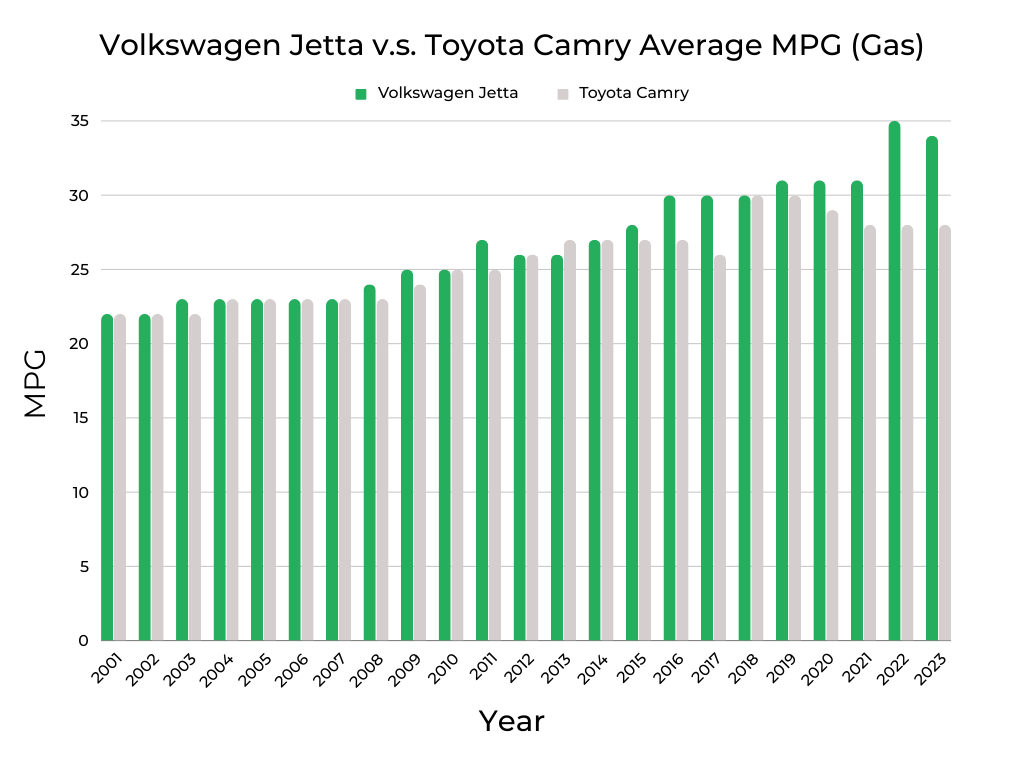
One final factor you’ll want to consider in your used car buying journey is fuel economy. The chart on the left above shows how the Jetta and Camry stack up on this topic for the past 20 years in traditional gas-powered models.
The ratings are close for the most part, though the Jetta does edge out the Camry in 12 of the 23 model years shown. The gap becomes more pronounced over the past few years as the Jetta offers only a small displacement four-cylinder powertrain, while the Camry offers something similar plus a more potent – and thirsty – V6.
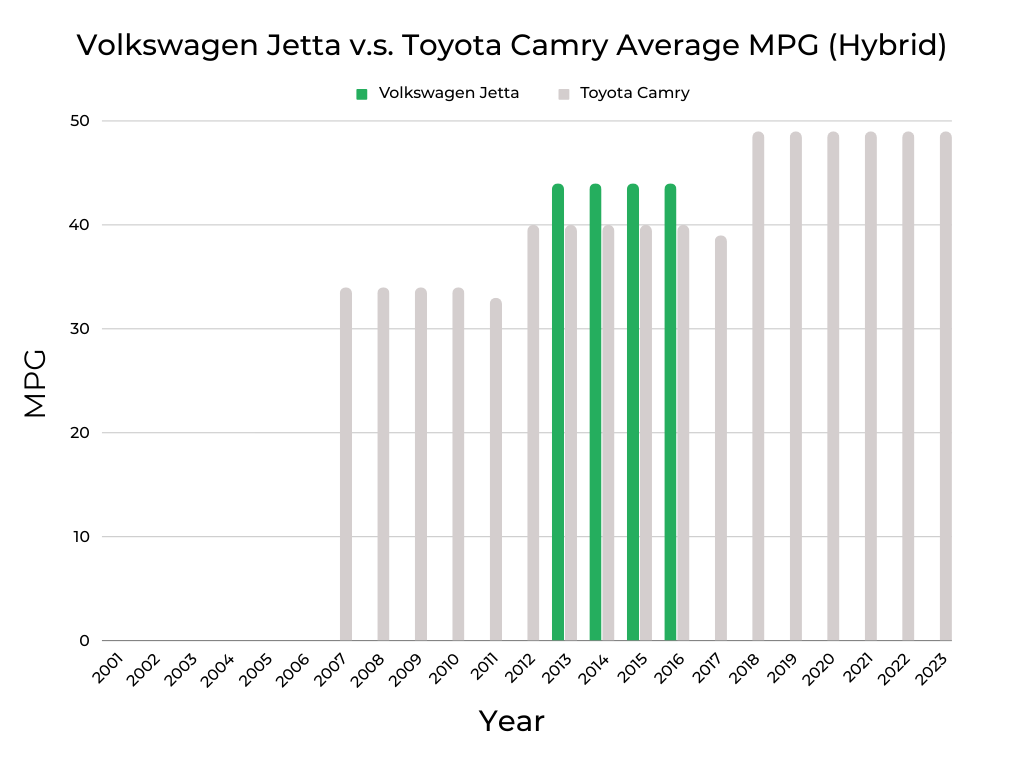
On the right, you can see a chart comparing fuel efficiency for hybrid-powered Jettas and Camrys. It’s too bad VW only offered a hybrid Jetta from 2013 to 2016 as it was a fuel economy champ with an average rating of 4 mpg higher than the Camry over that span.
Which brings us to a final point. The 2012 and 2013 Toyota Camrys are in the sweet spot for deprecation and maintenance costs per mile, get a thumbs up on our model year rankings, AND came in a hybrid model that is rated for about 40 mpg. If I were shopping these two cars, that’s where I’d start.

Niel Stender grew up doing replacement work on his old Cherokee and sweet Mitsubishi Starion, which led to a degree in mechanical engineering and a job at Ford as a vehicle dynamics engineer. His writing infuses that automotive background with sales and marketing experience. Writing about cars for close to a decade now, he enjoys digging into some of the more technical mechanical systems under the hood and throughout a vehicle.


