The Ford Fusion is a midsize family sedan first introduced for the 2006 model year. It quickly became popular due to its stylish design, comfortable interior, and excellent performance. Unfortunately, it was discontinued after the 2020 model year.
The Fusion has been regarded as a great family car, even winning the Best Family Sedan in the 2017 Motorweek Drivers’ Choice Awards. However, there are some years you should avoid. We have used data from FIXD devices installed in thousands of Ford Fusions, owner surveys, safety information from the National Highway Traffic Safety Administration (NHTSA), and other pertinent information to create an extensive analysis of the best and worst years of the Ford Fusion.
We have put the essential points in this table, followed by detailed graphs on the Ford Fusion’s reliability, safety, MPG, and value stats year-by-year.
| Best Years | Why? | Worst Years | Why? |
| 2019-2020 |
Perfect FIXD Reliability Score, 9/10 owner reliability score, low ownership costs, and no recalls to date |
2006-2007 |
Low FIXD Reliability Score, low safety ratings, high annual repair costs |
| 2018 |
A low number of DTCs, low recalls, excellent safety rating, and low repair costs |
2009 |
Low mpg, high amount of complaints, low FIXD Reliability Score |
| 2016-2017 |
Low number of safety recalls, good reliability scores and low cost of maintenance |
2013 |
First model year of 2nd generation, many recalls, engine and transmission issues |
| 2012 |
Low number of severe DTCs, high owner score, ownership costs comparable to newer cars |
2010-2011 |
Large number of recalls and complaints, powertrain and engine issues |
| 2008 |
Perfect Owner Reliability Score, new features, low DTCs |
2014-2015 |
A large number of recalls, less than average safety scores, severe DTCs |
Ford Fusion Engine Reliability Score, Safety Ratings, MPG and Value v.s. Maintenance & Repair Costs – Year by Year
When we organized the best and worst years of the Ford Fusion, we looked closely at multiple sources of information. The two most prominent are the FIXD Reliability Score and the Owner Reliability Score, which are from FIXD devices installed in Fusions and surveys from Fusion owners.
We also gathered the safety ratings from NHTSA.gov, pulled the MPG from fueleconomy.gov, and the market value from Kelley Blue Book (KBB). We included an owner-reported figure for annual repair costs before graphing all the data and inserting it below.
The last things we looked at were diagnostic trouble codes (DTC) for each year and important safety recall information.
If you’re in the market for a car, take a look at our article on the USAs’ most reliable and cheapest to repair cars in the U.S. Don’t get stuck with a lemon, use our data to help you shop.
Engine Reliability Score – Over The Years

Reliability is the most critical determinant in our analysis and ordering of the best and worst years. We’ve devised two unique scores using our exclusive data, making it easy to compare. Both scores use the same scale: 1 is the lowest, 5 is the average, and 10 is the highest level.
The first score is the FIXD Reliability Score, represented by the green line on the graph. We calculated this score by tracking the number of check engine lights (CEL) reported by our app users and dividing it by the number of cars. We then weighted the score based on an average of 12,000 miles driven annually.
The second score, the Owner Reliability Score (gray line), comes from surveys taken by Ford Fusion owners. These surveys capture their firsthand experience and provide subjective opinions on reliability. We translated these responses into numerical scores. For more details on the question asked and our methodology for determining this score, please refer to the note about data and information section located at the bottom of this article.
Overall, newer years of the Fusion have higher reliability scores. You’ll also notice the Owner Reliability Score is higher than the FIXD Reliability Score in all but the final three years.
A car’s reliability is often worse than an owner might want to believe. We hypothesize that owners of older models slowly become accepting of higher-than-average check engine lights being thrown because they have owned the car for a long time. They are either a frog in a pot of boiling water, not realizing the car is deteriorating slowly and getting worse. OR they simply haven’t compared the reliability of their older model to the often newer and more reliable models of today.
Sometimes companies will extend warranties, such as Ford did for the 1.6L engine it created.
Loyalty to an older vehicle may also affect the Owner Reliability Scores. If a car has lasted 20 years, it would be immensely reliable in the owner’s eyes, even if it had to have repairs and triggered many CELs along the way.
An older model, the 2008 Fusion, scored the highest Owner Reliability Score of all model years. This is partly due to having less data for that year than other years.
Most of the time, reliability scores are lower in the first year of a generation. While the Fusion only has two generations, both first years of each generation (2006 and 2013) have some of the lowest reliability scores. This is because a new generation has new features and upgrades that tend to bring new problems with them.
You can use our reliability scores if you’re shopping for a used Ford Fusion. You can also use the scores to determine if an older model you already own is worth fixing or if you should consider buying a newer model.
If you need more information about the most common Ford engine codes, we wrote an article about Ford check engine lights and the most common codes that cause them.
NHTSA Safety Score – Over The Years
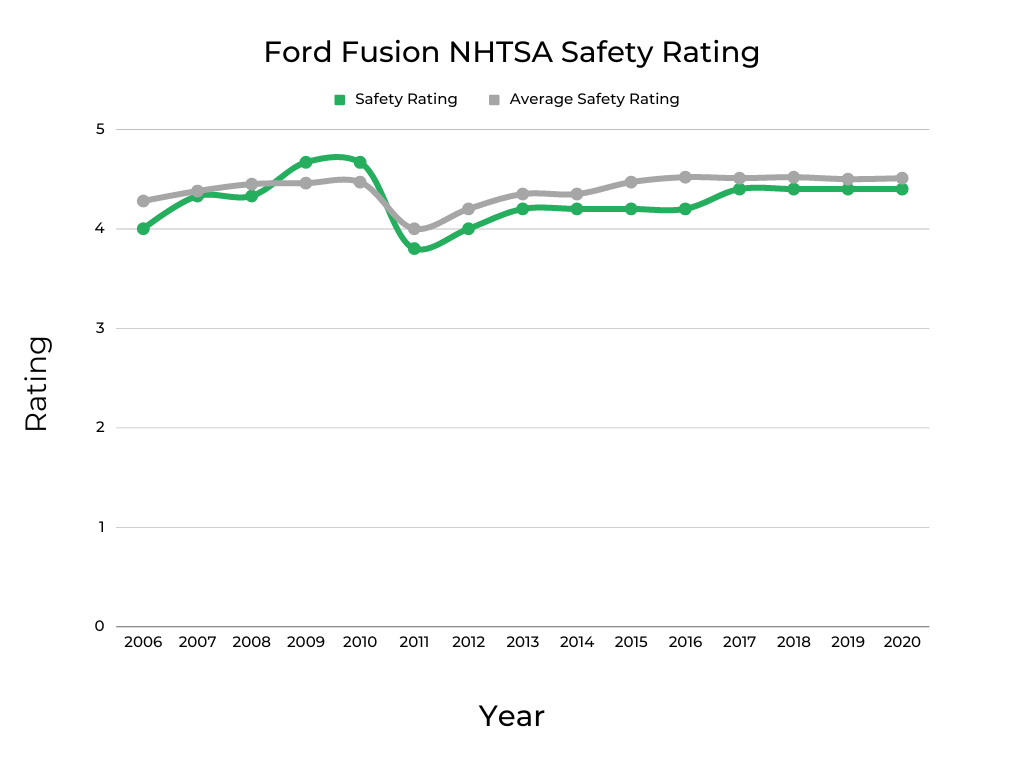
The NHTSA Safety Score is an essential element we considered while ranking the Ford Fusion. The safety rating for the Fusion is represented by the green line, while the gray line shows the average of all vehicles we have data for.
The Fusion safety rating is very close to average and follows the same overall trend. The best years are above the overall average, with 2009 and 2010 scoring an average of 4.6 stars. Only 2011 drops below four out of five stars, rating 3.8/5.
The best years of the Ford Fusion, 2019-2020, score 4.4 on their safety rating. In comparing other midsize sedans, both the Toyota Camry and Honda Accord scored a perfect 5/5 in those same years.
Higher safety ratings can help you get cheaper car insurance and save money on your annual ownership costs. The Ford Fusion is also considered a family sedan; therefore, knowing which model years are the safest is important.
If you live in one of the states listed below, we can show you the cheapest vehicles to insure in yours.
| What Used Cars Are the Cheapest To Insure In: |
| Ohio |
| North Carolina |
| Michigan |
| Georgia |
| Texas |
| New York |
| Illinois |
| Pennsylvania |
| California |
MPG – Over The Years
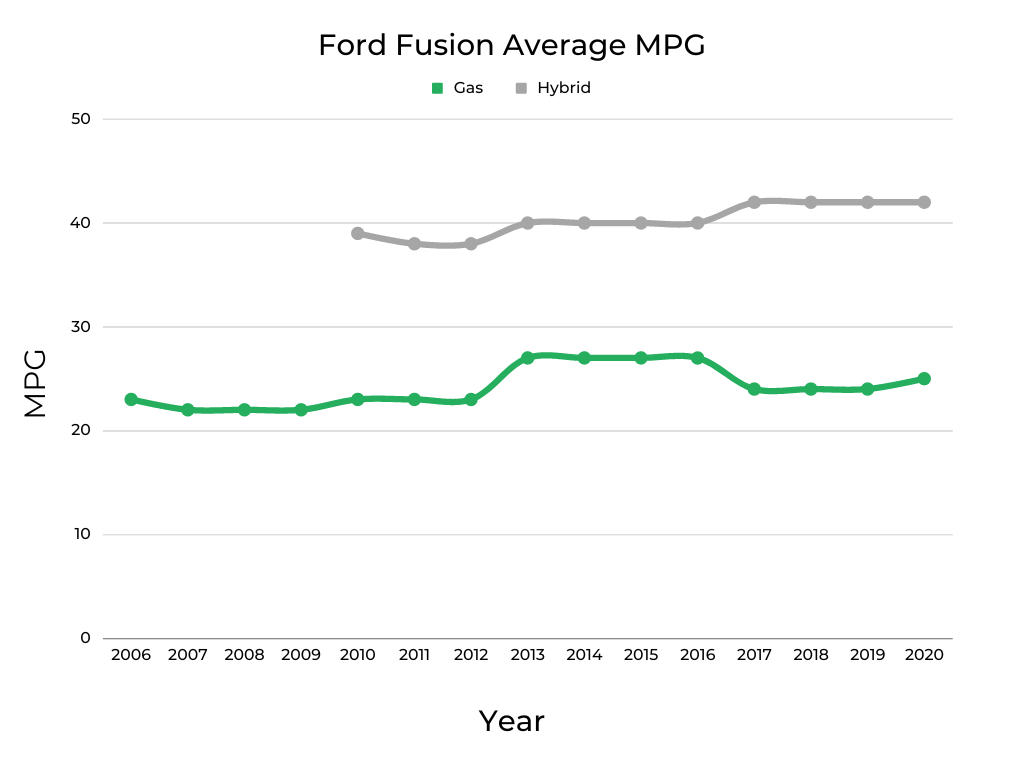
The graph above shows the average combined miles per gallon for the Ford Fusion. The green line represents the standard gasoline model. The gray line shows the average fuel economy for the hybrid models in production starting in 2010. All of this data is found on fueleconomy.gov.
The Fusion started with fuel efficiency in the low 20s, but the second generation increased to 27 mpg in 2013. The turbo-charged engines helped it stay at 27 mpg before dropping to 24-25 mpg for the remainder of its production life.
The first year of the hybrid, 2010, started at a solid 39 mpg. It dropped to 38 mpg in 2011, before an increase in 2013 to 40 mpg. Another increase in 2017 to 42 mpg rounded out its life cycle.
Current Market Value of All Ford Fusion Years & Cost Per Year to Repair and Maintain Each
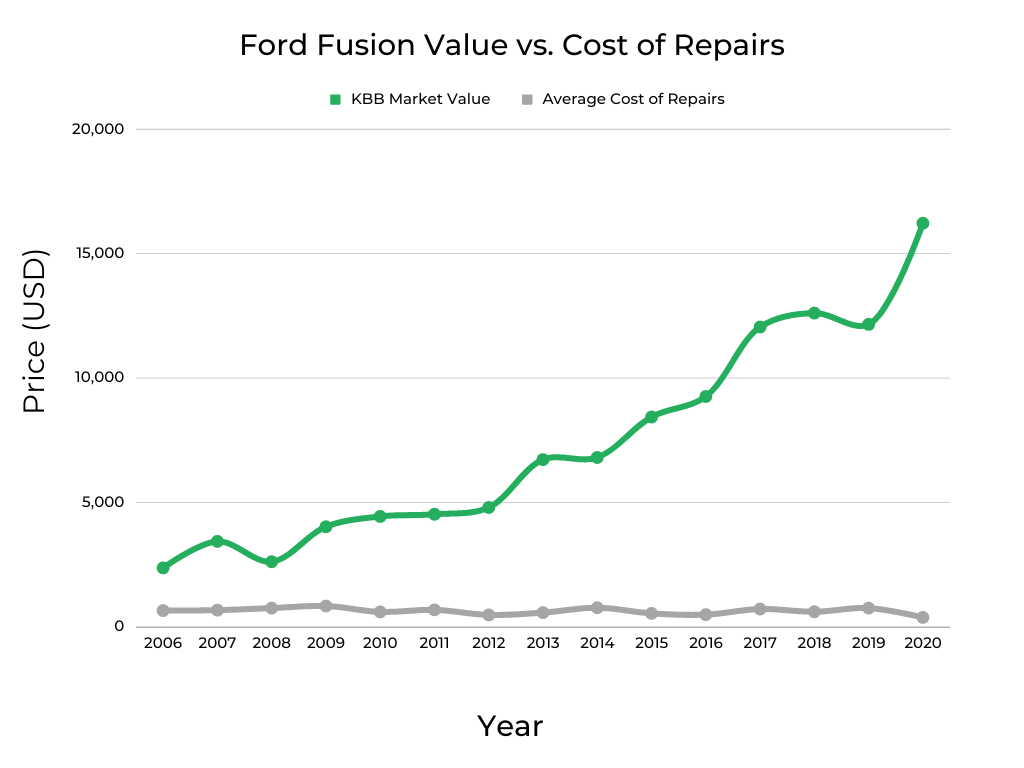
The green line in the graph above shows the Kelley Blue Book market value for each year of the Ford Fusion. The gray line represents the owner-reported cost of repairs and maintenance per year. The newer vehicles tend to have higher value and lower costs, while the older ones have lower value and higher repair costs. However, there are exceptions.
The 2008 Fusion drops in value, mainly because of our lack of data and the average mileage of 225,000 miles. This is higher than the average mileage of the 2007 and 2009 Fusions. (150,000 and 125,000 miles) High mileage lowers the vehicle’s value, and the 2008 average is much higher.
This happens again in 2019, where the average mileage was a pretty steep 100,000 miles, and the 2018 owners reported 86,765 miles.
The repair and maintenance costs remain consistent across all years of the Fusion. The highest is in 2009 at $833, while 2020 only costs $350 annually. The average repair and maintenance cost of all Ford Fusions is $622 a year.
If you’d like to learn about this vehicle’s past depreciation rate & our projected depreciation rate based on that, check out: Ford Fusion | Depreciation Rate & Curve Graphed.
When shopping for a used Ford Fusion, it’s important to keep in mind that not all vehicles are cared for equally. To protect yourself from lemons, take along a FIXD Sensor on your test drive. FIXD connects to a free app on your smartphone to tell you more about the vehicle you’re checking out, including check engine lights and other hidden issues that the owner or dealership may be attempting to hide. Click here to learn more and get FIXD for only $19.99 (regular price $59)!
Important Features Timeline
The Best Years of the Ford Fusion

After reviewing the FIXD Reliability Scores, Owner Reliability Scores, safety ratings and fuel economy, we have listed the best years of the Ford Fusion below, from best to worst. We also included information about the vehicles’ market value, and annual repair costs before going over the most common DTCs and important information about recalls.
2019-2020 Ford Fusion
FIXD Reliability Score: 10/10
Owner Reliability Score: 9/10
KBB Value: $12,159-$16,222
Fuel Economy: 24-25 mpg
Annual Maintenance/Repair: $375-$750
Safety Rating: 4.4/5
It’s no surprise that the newest Ford Fusion is the most reliable. 2019-2020 Ford Fusion is a reliable midsize sedan available in five different trims with multiple engine options. The last years before the car was discontinued have the best reliability scores, low cost of ownership and great safety ratings.
The FIXD Reliability Score is the highest for all Fusions at a perfect 10/10, ending its run 14 years on a good note. The Owner Reliability Score is also impressive, getting 9/10. Owners liked the comfortable seats, and 20% of the 2020 Fusion owners believe it will make it over 200,000 miles.
Safety is a significant factor for the sake of the family and passengers and to help save money on car insurance. The 2019-2020 Ford Fusion scored an average of 4.4 out of 5 stars, making it a safe midsize sedan. This is better than the Chevrolet Malibu, which scored 4.2 out of 5, but a worse rating than the Honda Accord which scored a perfect 5/5.
The biggest difference between 2019 and 2020 is the repair costs. The 2020 Fusion boasts a low annual cost of $375, while 2019 is well above average at $750. The average cost of repairs and maintenance for the Ford Fusion is $622.
The most common DTC for the 2019-2020 Ford Fusion is P0496, which is a low-severity issue with the EVAP flow. 2019 also throws the codes P0420, catalyst system efficiency below threshold (Bank 1), and P0456. P0420 can indicate a bad catalytic converter, but could also be a bad oxygen system or a misfire. P0456 is most commonly a loose or damaged fuel cap.
The second most common code for 2020 Fusion is P0036 and P0101, which might be a bad O2 Sensor.
Ford is one of the most heavily recalled brands of cars. One of the most impressive things about the 2019 Fusion and 2020 Fusion is the fact that they have no recalls as of writing this.
2018 Ford Fusion
FIXD Reliability Score: 8/10
Owner Reliability Score: 8/10
KBB Value: $12,610
Fuel Economy: 24 mpg
Annual Maintenance/Repair: $603
Safety Rating: 4.4/5
The last five years of Fusion production do well on our list, and the 2018 falls in line with high reliability and good safety scores. It was generally unchanged from the year before, but fewer recalls and DTCs put it above the 2016 and 2017 models.
Both the FIXD and Owner Reliability Scores are 8/10; owners have a pretty good understanding of the impressive reliability of the 2018 Ford Fusion.
The safety rating for 2018 stays at 4.4 out of 5 stars, a great rating for a midsize family sedan. It is barely below the average across all vehicles.
Annual repair costs are below average at only $603. There is a 95% chance you’ll have a repair over $500, which isn’t surprising since the average mileage is 86,765. The good news is the average time spent in the shop is only 0.9 days, almost a full day less than the average 1.7 days.
The most common DTC for the 2018 Fusion is P0316, “Engine Misfire Detected on Startup.” This is a severe code and needs to be addressed as soon as possible to avoid internal engine damage that could ramp up the cost of repairs. This sedan’s second most common code is P0302, a cylinder 2 misfire detected. This might require replacing spark plugs.
There are only two recalls for the 2018 Ford Fusion, one investigation, and 139 complaints. The recalls are intimidating, one potentially causing the steering wheel to detach, and the other is a rupture in the front brake hoses. Both should be repaired before you purchase a used 2018 Fusion or as soon as possible if you already own one.
2016-2017 Ford Fusion
FIXD Reliability Score: 7/10
Owner Reliability Score: 8-9/10
KBB Value: $9,258-$12,050
Fuel Economy: 24-27 mpg
Annual Maintenance/Repair: $487-$713
Safety Rating: 4.2-4.4/5
The 2016-2017 Ford Fusion is a much better vehicle than the first year of that same second generation (2013). A new Platinum trim premiering in 2017 gives the Fusion a fancy feel and might appeal to people looking for a luxury vehicle like a Lexus or Infiniti. A V6 Sport trim was introduced, which gives the buyer four different engine sizes to consider while shopping for a used Ford Fusion.
The FIXD Reliability Score dropped from 8/10 in 2018 to 7/10 for the 2016-2017 model. This is also the first time the Owner Reliability Score overcomes the FIXD score, with 8/10 in 2016 and 9/10 in 2017.
Safety scores stay in line with the rest of the second generation, at 4.2 and 4.4 out of 5 stars. The Toyota Camry scored 4.6 out of 5 for these years, and the Accord continued its perfect streak of 5/5.
Repair costs differ between these models but are still not too high for cars reporting 76,852 (2017) and 101,316 (2016) miles. The 2016 Fusion will only cost you $487 a year to maintain, while 2017 jumps above average at $713. The higher repair costs for 2017 are offset by only 88% of owners reporting having a repair over $500, which is 4% less than average.
A common code shared between both models is P0316. Our data shows the most common repair for P0316 in the 2016 Ford Fusion is spark plugs, which cost $58-$167. A more concerning code for 2016 is the potential P0420, which might indicate a bad catalytic converter and cost $1,538-$2,041.
One downside is that the recalls start to pick up steam with these models, as the 2016 Fusion has ten with five investigations and over a thousand complaints. The 2017 Fusion fares a little better with only four recalls but still has one investigation and over five hundred complaints. The recalls range from the steering to the power train.
2012 Ford Fusion

FIXD Reliability Score: 5/10
Owner Reliability Score: 8/10
KBB Value: $4,794
Fuel Economy: 23 mpg
Annual Maintenance/Repair: $475
Safety Rating: 4/5
The 2012 Ford Fusion was the last year of the first generation, and we recommend considering this year if you are shopping for a used car. There are five trim levels with various features and performance options.
The FIXD Reliability tumbles two points from the previous entry but still sits at an average of 5/10. The Owner Reliability Score stays high, at 8/10.
The safety rating in the 2012 Fusion could use some improvement, scoring only 4/5. This is tied for the second-lowest safety rating among Fusions but isn’t that far below the average overall safety rating across all vehicles. In comparison, the 2012 Chevrolet Malibu got 4.2/5.
The repair costs are fairly low, only $475, but 100% of owners reported a repair of over $500. However, 8.11% of those repairs were in the brakes, which isn’t shocking considering the average mileage is 122,619.
The most common DTC for an expensive brake repair is P1000, which our data shows require an Antilock Brake System Control Module, costing $928-$1,193. Another common code for the 2012 Fusion is P0456, which is an evaporative emission control system leak and is most often a loose gas cap.
Recalls on the 2012 Ford Fusion are fairly average, with six. All recalls can be performed at no cost to the vehicle owner by appointment with a Ford dealer.
2008 Ford Fusion
FIXD Reliability Score: 5/10
Owner Reliability Score: 10/10
KBB Value: $2,614
Fuel Economy: 22 mpg
Annual Maintenance/Repair: $750
Safety Rating: 4.3/5
The 2008 Ford Fusion got excellent reliability scores even though it is 15 years old. With the addition of standard anti-lock brakes, this model was a step up after the first and second years of the Fusion.
The 2008 Fusion is the only model with a perfect 10/10 on the owner reliability score, while the FIXD Reliability Score was an average of 5/10. The high owner score could be related to our lack of data for 2008.
The safety rating of the 2008 model is 4.3 out of 5 stars, but according to NHTSA, it scored 5 out of 5 on its rollover and side crash tests. For comparison, the 2008 Nissan Altima scored 4.8 out of 5 stars.
The owner reported repair and maintenance cost was above average at $750 per year. The average mileage is 225,000, which makes it more susceptible to repairs.
While 2008 has its fair share of DTCs, we lack data for repair estimates related to the most common. However, the most prevalent code is P1000, which required an anti-lock brake system control module in other years, such as 2010 and 2011. The ABS control module could cost $928-$1,193.
Recalls are once again in the middle of the pack for this Ford. The 2008 Fusion has seven recalls, five investigations, and 1,339 complaints. Five out of seven recalls and 680 complaints are airbag related.
The Worst Years of the Ford Fusion

Using the same data, we have compiled a list of Fusions you should avoid, from the worst to the best. We looked at the FIXD Reliability Score, Owner Reliability Score, NHTSA safety ratings, MPG, annual maintenance cost, the common DTCs, and important safety recalls before ranking the worst years of the Ford Fusion. You’ll find a much higher number of recalls and much more severe DTCs in these inferior Fusions.
2006-2007 Ford Fusion
FIXD Reliability Score: 2/10
Owner Reliability Score: 5-7/10
KBB Value: $2,365-$3,431
Fuel Economy: 22-23 mpg
Annual Maintenance/Repair: $650-$667
Safety Rating: 4-4.3/5
The inaugural years of the Ford Fusion didn’t age well, getting the lowest reliability scores out of all the Fusions. The safety ratings are also lower than in later years (except in 2011), and the fuel economy is poor compared to other midsize sedans.
The safety rating for the 2006-2007 Ford Fusion is only 4 and 4.3. This is below the average of all vehicles we have data for, and 2006 (4/5) is lower than most Fusions. 29% of 2006 owners use their Fusion as a family vehicle. Therefore it is important to consider safety ratings.
The repair costs of this Fusion aren’t too bad, just barely above average at $650 and $667. However, 100% of the 2007 Fusion owners have paid for a repair of over $500. Pair that with mileage above 150,000; we recommend avoiding this Fusion model.
The most common DTC for 2006-2007 Fusion is P1000, which has resulted in a pricey ($928-$1,193) ABS control module replacement. Another CEL is caused by P0420, which is the catalytic converter and could tack on another $1,538-$2,041 to your repair bill.
The recalls for the 2006 and 2007 Fusion are relatively low, with five each, and they are the same five for both years. However, the complaints are still high at 724 and 1,052, respectively. Therefore, despite the low number of recalls compared to other Fusions on this side of the list, avoid this Fusion and choose one of the best years.
2009 Ford Fusion
FIXD Reliability Score: 2/10
Owner Reliability Score: 8/10
KBB Value: $4,020
Fuel Economy: 22 mpg
Annual Maintenance/Repair: $833
Safety Rating: 4.6/5
The 2009 Ford Fusion continues the trend down for FIXD Reliability Score. The halfway mark of the first generation, 2009, offered optional traction control and a new Blue Suede package. It also offers high repair costs and low fuel economy.
The FIXD Reliability Score is 2/10, tied for the worst of all Ford Fusions. While the Owner Reliability Score still doesn’t agree with our FIXD data, at 8/10, it is still low compared to others. The average Owner Reliability Score is 8/10.
Safety is one thing the 2009 Fusion got right. It has a 4.6-star rating, above the average for all vehicles for the second and last time (the other year is 2010). This is also a higher rating than the 2009 Honda Accord, which scored 4.4 that year.
Another reason to avoid the 2009 Fusion is that this year’s repair costs are the highest at $833. There is a 100% chance of a repair above $500, and the average mileage is 125,000.
The top DTCs for 2009 are P1000 and P0128. The fix for P100 is an ABS control module ($928-$1,193). P0128 means “Coolant Thermostat Temperature Below Regulating Temperature,” and it isn’t severe but could require a thermostat or temperature sensor. In the 2009 Fusion, the engine coolant thermostat has been the typical fix and cost anywhere from $2,049 to $2,567.
Safety recalls are on the high side for the 2009 Fusion at eight. There are also four investigations and 998 complaints. The recalls and complaints are heavily airbags, which isn’t an uncommon problem for any midsize sedan.
2013 Ford Fusion
FIXD Reliability Score: 3/10
Owner Reliability Score: 9/10
KBB Value: $6,720
Fuel Economy: 27 mpg
Annual Maintenance/Repair: $568
Safety Rating: 4.2/5
With a completely redesigned look, new technology, and better fuel economy, Ford pulled out all the tricks when they released the second generation of the Fusion. But, unfortunately, 2013 didn’t stand the test of time and had many concerning DTCs and safety recalls that aren’t worth the hassle of owning this particular Fusion.
The FIXD Reliability Score is only 3/10, indicating the new problems and issues that come with a new generation. On the other hand, the Owner Reliability Score is at a very high 9/10, possibly due to loyalty or because owners have become accustomed to the number of check engine lights (CEL).
The safety rating is 4.2 out of 5, less than average and far inferior to the 2013 Nissan Altima, which scored a perfect 5/5.
One silver lining about the 2013 Fusion is the low cost of annual repairs and maintenance. This might contribute to the high Owner Reliability Score, as the repairs aren’t pricey even though there are many CELs. Also, only 75% of 2013 owners say they had a repair costing over $500. The average for all Fusions is 92%.
We cannot discuss positives for long, as the 2013 Fusion’s most common DTC is P0420, which was commonly fixed by replacing the catalytic converter. This repair costs anywhere from $1,538 to $2,041. The following most common code, P0316, isn’t as severe, requiring a fix costing only $54-$163. P0316 means “Engine Misfire Detected on Startup” and could require ignition coil replacements.
The 19 recalls, six investigations, and 1,789 complaints on the 2013 Ford Fusion are enough for us to recommend avoiding it entirely, but if you already own one, it is important to be aware of them. Most complaints are about the engine or the power train, while the recalls deal heavily with the transmission.
2010-2011 Ford Fusion

FIXD Reliability Score: 4/10
Owner Reliability Score: 7/10
KBB Value: $4,434-$4,522
Fuel Economy: 23 mpg
Annual Maintenance/Repair: $596-$679
Safety Rating: 3.8-4.6/5
The 2010-2011 Fusion introduced a six-speed transmission and a new Sport trim that can produce up to 263 horsepower. Unfortunately, these fail to make up for the setbacks in this model, and we recommend avoiding 2010 and 2011 if you are shopping for a used Fusion.
The FIXD Reliability Score finally falls below average in these years, registering at 4/10. However, the Owner Reliability Score is still higher at 7/10, showing that people love the Ford Fusion and are willing to look past the problems in one of the worst years.
The safety ratings were the worst in 2011, only scoring 3.8 out of 5 stars. There are much better options for the Ford Fusion with the same market value and high safety ratings. Don’t forget excellent safety ratings can help you get lower insurance rates.
Repair costs hover close to the average of $622, ranging from $569 to $679. While the annual costs aren’t abnormally high, 100% of owners claim to have paid over $500 for a repair at one point or another. Considering that the average mileage is over 130,000 for these models, these are repairs you probably want to avoid.
An extremely concerning DTC is the most common for the 2010-2011 Ford Fusion, P1000. This typically requires a repair of the ABS control module and costs around a thousand dollars. Another common code is a cylinder 1 misfire, P0301. This might require spark plugs but could cause engine damage if it isn’t addressed quickly. There is also P0455 present, which might be a loose gas cap but could also be related to anything in the EVAP system.
Your mailbox will be full of recall notices for the 2010 Ford Fusion since it has 13, but the more significant concern is the nine investigations and an incredible 4,909 complaints. 789 of the complaints are related to the vehicle speed control, with owners saying the car went into limp mode at high speeds. There are also 879 complaints about the power train, with jerking and loss of power a common issue. The recalls are mainly related to airbags, but seven total components are affected.
The 2011 Ford Fusion is a little better, but still not worth the risk. This Fusion has nine recalls, three investigations, and 2,554 complaints. While recalls are fixed free of charge, the enormous number of complaints over these years forces us to suggest avoiding them altogether.
2014-2015 Ford Fusion

FIXD Reliability Score: 5/10
Owner Reliability Score: 8-9/10
KBB Value: $6,806-$8,432
Fuel Economy: 27 mpg
Annual Maintenance/Repair: $536-$764
Safety Rating: 4.2/5
The 2014-2015 Ford Fusion has similar reliability scores to Fusions on the other side of the list, but the outrageous number of recalls and severe DTCs lead us to believe you should avoid this Fusion. However, another engine option was added in 2014, and backup cameras became standard in 2015.
The FIXD Reliability Score is 5/10, while surveyed owners gave it 8 and 9 out of 10. This high Owner Reliability Score can be related to great experiences with the car despite the engine lights and recall notices arriving in the mail.
The safety score is nothing to celebrate for a family sedan at 4.2/5, but they aren’t terrible either. While it falls below the average of all vehicles, the comparable Nissan Altima scored 4.2 in 2015.
There is a difference of over $200 in repair costs for these years, with 2015 coming in at a low $536 and 2014 requiring $764 yearly. According to the answers given by owners, there is a 93% and 100% chance of a repair over $500.
A shared common DTC for 2014 and 2015 is P0420 or catalyst system efficiency below threshold. This code means the catalytic converter is not working correctly, which is vital to your engine performance. A catalytic converter replacement can cost $1,538-$2,041. Another common code in the 2014 Fusion is P0303, a misfire in cylinder 3 that might require a spark plug ($111-$302).
It isn’t a Ford unless it has some recalls, and these years of Fusion take it to another level. The 2014 Fusion has a staggering 19 recalls, dealing with nine major areas. Most of these recalls are in the powertrain, with some problems with the transmission cable detaching and the car rolling away. In addition, there are multiple recalls about the doors coming open while driving, which could be a significant hazard while traveling with your family. The 2015 Fusion has 13 of its recalls, many of the same as in 2014. It also has five investigations and 782 complaints.
FAQs
What years of the Ford Fusion have engine and/or transmission problems?
Overall, the Ford Fusion is a dependable vehicle. As with any car, engine, and transmission problems can be unique based on use and maintenance. Most of the years of the Fusion don’t have any significant engine or transmission issues, although there are some to know about. 2013, 2014, and 2015 all have many complaints about the engine. The 2015 Ford Fusion has 204 out of its total 782 complaints about the engine.
There are also a fair number of complaints about the powertrain in these years, particularly in 2014, with 216. The 2013 Fusion also has a few recalls regarding transmission issues that could be a safety hazard. Some of these exact recalls were issued for the 2014 and 2015.
According to our FIXD data and owner surveys, the 2013 Fusion has a 75% chance of a $500+ repair. 25% of those repairs were engine-related. In 2014, 93% reported a repair over $500, with 10% being in the transmission.
What is considered high mileage for a Ford Fusion?
The Ford Fusion has an average reported mileage of 126,286 miles, with the highest recorded mileage reaching an impressive 225,000 miles. These figures highlight the Fusion’s durability and longevity when properly maintained. However, it’s important to remember that every vehicle is unique, and mileage should be evaluated individually.
While the data suggests that high mileage for the Fusion would be over 175,000 miles, treating each car as a separate case is crucial. Regular inspections are recommended to assess the overall condition and determine if the mileage in your Fusion is concerning.
Do any hybrid years have problems?
The Ford Fusion hybrid began production in 2009, with the 2010 model being its first. The hybrid Fusion is a reliable vehicle that doesn’t have many problems. However, there are some issues relating to power steering, particularly in the 2010 Ford Fusion, where there are 145 complaints about steering issues. This model also has some complaints about the engine stalling. Since it was the first year of production, there are bound to be brand new problems, just like a first year of a new generation of vehicles. Overall, it was a popular hybrid choice and considered a dependable car. The Ford Fusion hybrid was made for ten years before being discontinued after the 2020 model year.
What other vehicles should I consider?
While the Ford Fusion is a popular choice in the mid-size car segment, several other options are worth considering when shopping for a vehicle in this category. One alternative within the Ford lineup is the Ford Focus. The Focus offers a smaller footprint than the Fusion but still provides a comfortable and efficient driving experience. With its stylish design and range of available features, the Focus is an excellent choice for those seeking a compact yet practical vehicle.
If you’re open to exploring options beyond Ford, the Toyota Camry is a highly regarded mid-size sedan. Known for its reliability, the Camry offers a smooth ride, spacious interior, and advanced safety features.
Another noteworthy option is the Honda Accord. Renowned for its reputation of reliability and strong resale value, the Accord offers a comfortable cabin, generous trunk space, and a refined driving experience.
The Chevrolet Malibu is another midsize family sedan comparable to the Ford Fusion. It has a spacious interior and supportive seats while providing a quiet and smooth ride. It also has good safety scores and low ownership costs.
Finally, the Nissan Altima is a midsize car focusing on comfort and performance. It is a solid competitor regarding safety scores and fuel mileage and is a perfect family vehicle or commute car.
What owners of the Ford Fusion like to use their car for:
Being a mid-size sedan, the most popular use for the Ford Fusion is as a family vehicle. 50% of owners use Fusion as their family car, while 32% use it for traveling or a long commute. The following most common uses are luxurious driving at 8%, an office on wheels at 5%, and sport/fast driving at 4%. Outdoor driving and towing are what the car is used for the least, at 1% for each.
| Frequent Use Categories: | How Useful? (Out of 5 Stars) |
| Family Vehicle | ***** |
| Lots of Driving (travel/long commute) | **** |
| Hauling/Towing | * |
| Office on Wheels | * |
| Sport/Fast Driving | * |
| Luxurious Driving | * |
| Outdoor/Off-Road | * |
A Note About Data and Information Sources
This article has many details about Ford Fusion reliability; here’s what we used for our assumptions and recommendations.
- FIXD Reliability Score & Data: Engine reliability information is captured via the FIXD App.
The FIXD Reliability Score is calculated using the number of DTCs per year, weighted by mileage. This is then turned into a scale of 1-10 for easy graphing.
This is an objective score.
- Owner Reliability Score & Data: This data is the result of surveying Ford Fusion owners who use FIXD.
The Owner Reliability Score comes straight from owners of the Ford Fusion.
This is a subjective score.
To determine the Owner Reliability Score we ask each car owner:
How reliable would you say your Ford Fusion is?
a. Just point A to point B driving
b. A Daily Commuter
c. Good for a 100 mile road trip
d. Good for a 500 mile road trip
e. I could take a cross-country road trip, no problem
From here we translate their answers into the Owner Reliability Score:
a. = 2
b. = 4
c. = 6
d. = 8
e. = 10
Keep in mind, owners may think their car is more or less reliable than it actually is.
One potential problem is that people often buy the same make or model they are used to when they go car shopping, just a newer year.
Ford, for instance, has a number of consumer loyalty awards for the Ford F-Series, Ford Mustang, and Ford Expedition.
Car owners may be so loyal to the make or model they currently own that they would have trouble accurately comparing their cars’ reliability to others.
It’s for this reason that we ask car owners a question that is relative to mileage rather than relative to other cars.
Still, be mindful of the accuracy of these Owner Reliability Scores, people’s perceptions and unconscious blindspots can skew data.
We suggest looking at both the FIXD Reliability Score and the Owner Reliability Score for this reason.
- KBB Value: Average private-seller valuations as supplied by Kelley Blue Book (KBB), based on a Ford Fusion with typical mileage for that respective model year.
- Fuel Economy: Mileage-per-gallon estimates according to the EPA MPG on Fueleconomy.gov
- Annual Maintenance/Repair: Upkeep expenses as reported by surveyed Chevrolet Equinox owners
- Safety Rating: Crash test data collected and reported by NHTSA. We average all ratings for each year to come up with a simplified, average safety score. This makes it easier to look at on a graph.
References
- Ford Fusion model-specific information, edmunds.com (various dates). Retrieved May 22, 2023, from https://www.edmunds.com/
- Model-specific recall information as per the National Highway Transportation Safety Administration. Retrieved May 22, 2023, from https://www.nhtsa.gov/recalls
- Ford Fusion Named Best Family Sedan in 2017 Motorweek Drivers’ Choice Awards, Ford Media Center (February 9th, 2017). Retrieved May 22, 2023, from https://media.ford.com/content/fordmedia/fna/us/en/news/2017/02/09/ford-fusion-best-family-sedan-2017-motorweek-drivers-choice-awards.html
- Ford Fusion Generations, by Autolist Editorial, autolist.com (August 22, 2019) Retrieved May 22, 2023, from https://www.autolist.com/ford-fusion/ford-fusion-generations

Keith Rollins is a copywriter and author that has been involved in the automotive industry for over 12 years. He has written for hotcars.com and is featured on Copywriting.org. When he’s not writing he’s spending time with his three kids, hiking, working on cars, or running. You can see his work at keithrrollins.com.