Toyota RAV4 Engine Reliability Score, Safety Ratings, MPG, and Value v.s. Maintenance & Repair Costs Year by Year
The first chart below, Toyota RAV4 Reliability Score, is the main driver of our model year rankings. It is a combination of objective FIXD device data and subjective owner-reported information. Typically the first year of a new generation – like 2001 and 2006 – will struggle with reliability as the kinks are worked out, which is reflected in the chart.
From there, we blend in published government safety scores from the National Highway Traffic Safety Administration (NHTSA) and fuel efficiency figures per fueleconomy.gov.
We also incorporate market values from Kelley Blue Book (KBB) against owner-reported annual maintenance costs. That goes into the ranking decision along with owner survey answers and pertinent safety recalls. Lastly, with details on safety recalls, and common Diagnostic Trouble Codes (DTCs) we can create the final rankings below.
Engine Reliability Score – Over The Years
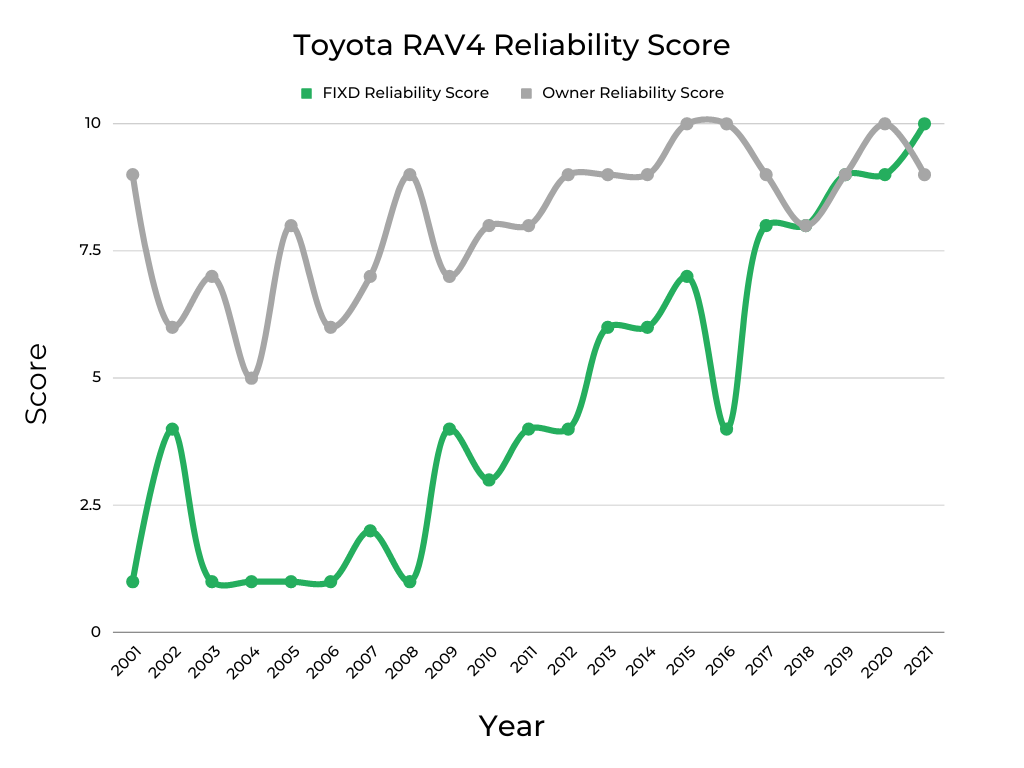
The green line on this Toyota RAV4 Reliability Score chart is based on the number of CELs thrown by each model year. After tallying them up, we weight this objective score by mileage and convert it into a 1-10 scale where 10 is the best and 1 is the worst.
By asking RAV4 owners, “How reliable would you say your car is?”, we can pull together a subjective reliability score for comparison. This multiple-choice question offers answers from “Just Point A to Point B driving” to “I could take a cross-country trip, no problem.” After converting the answer into a 1-10 scale, we create the gray line above.
As you can see, the objective and subjective reliability scores mostly move in the same direction. But occasionally, like in 2008, the scores diverge dramatically. We’ll explain this in the relevant sections below but it helps illustrate the importance of analyzing both sets of data.
You can learn more about our reliability scoring process at the bottom of this article and learn about some of the most common CELs to expect from Toyota.
NHTSA Safety Score – Over The Years

As you can see on the chart above, the Toyota RAV4 generally posts safety scores of 4/5 or higher. The dramatic dip in 2011 is a result of the NHTSA modifying its testing protocol that year to be more strenuous, which impacted RAV4 scores and the industry as a whole.
The gray line indicates the average crash test safety rating across the industry per published NHTSA data. The green line is based on data from the same source but only for the RAV4. As you can see, the RAV4 is generally in line with the industry average.
It’s also important to understand how a given model year of the RAV4 ranks for safety as it plays a big role in keeping insurance premiums down. If you live in one of the states listed below, we can show you the cheapest vehicles to insure in yours.
| What Used Cars Are the Cheapest To Insure In: |
| Ohio |
| North Carolina |
| Michigan |
| Georgia |
| Texas |
| New York |
| Illinois |
| Pennsylvania |
| California |
MPG – Over The Years

By averaging the combined fuel economy figures – from fueleconomy.gov – across all trims of each model year, we can create the above Toyota RAV4 Average MPG chart. As with most vehicles, the RAV4’s fuel economy typically increases from one generation to the next as engines and transmissions become more efficient and technology improves.
Highlights include 2019 when the average stepped up by four mpg thanks to the more fuel-efficient, and very reliable, fifth-generation RAV4 that launched that year. The gray line represents average efficiency for the hybrid RAV4, which arrived in 2016 followed by the second-gen model in 2019 and an 8-mpg fuel economy improvement.
Current Market Value of All Toyota RAV4 Years & Cost Per Year to Repair and Maintain Each

This chart plots current Toyota RAV4 market values from KBB against annual maintenance costs per owner surveys. It’s a valuable set of data points in defining why some model years are best avoided. For example, in 2004, the value metric (green) went against the trend. It’s one reason the 2004 RAV4 lands on our list of worst model years.
If you’d like to learn about this vehicle’s past depreciation rate & our projected depreciation rate based on that, check out: Toyota RAV4 | Depreciation Rate & Curve Graphed.
When shopping for a used Toyota RAV4 it’s important to keep in mind that not all vehicles are cared for equally. To protect yourself from lemons, take along a FIXD Sensor on your test drive. FIXD connects to a free app on your smartphone to tell you more about the vehicle you’re checking out, including check engine lights and other hidden issues that the owner or dealership may be attempting to hide. Click here to learn more and get FIXD for only $19.99 (regular price $59)!
Important Features Timeline

The Best Years of the Toyota RAV4

Taking into account FIXD and Owner reliability, government safety scores, fuel efficiency, and RAV4 owner survey responses, we’ve come up with this list of the best Toyota RAV4s. Pertinent recall information and notes about common DTCs are included as well.
2019-2021 Toyota RAV4
FIXD App Engine Reliability: 9-10/10
Owner-Reported Reliability: 9-10/10
KBB Value: $24,679-$29,449
Fuel Economy: 29 mpg
Annual Maintenance/Repair: $250-$625
Safety Rating: 4.6/5
Though the first year of any new vehicle generation is typically rife with reliability problems as the automaker works out kinks, that is not the case with the fifth-generation Toyota RAV4. Arriving in 2019, it improved the FIXD Reliability score by one point out of the gate and one more by 2021. All three years are high points for this metric.
Add in significant fuel economy improvements in both gas and hybrid models to 29 and 40 mpg, respectively, and it’s easy to see why this range of RAV4s takes top honors. Other highlights include solid owner-reported reliability, a strong market value trend, and just $250 in annual maintenance for 2021 models.
When Toyota unveiled this latest RAV4, it made particular note of how relocating the side mirrors, lowering the beltline, enlarging the rear quarter glass, and moving the instrument binnacle down was intended to improve driver visibility. It clearly worked as between 20 and 27 percent of owners say their RAV4 has excellent visibility.
Correlating with the relatively low annual repair costs are the three most common DTCs all incurring bills of $250 or less. First up is DTC P0128, which means the thermostat is acting up, as we talk about in our P0128 explainer video. It could simply require topping off the coolant, though a new thermostat runs about $250.
Representing an issue with an EVAP system valve, DTC P0441 could also be simply a loose gas cap. If the air-to-fuel mixture ratio is out of balance, you may see a CEL caused by DTC P0171. Have a look at this P0171 explainer video to learn why and be prepared to spend about $250 for a new oxygen sensor.
The 2021 RAV4 is noteworthy for having zero current safety recalls. For the 2020 model, there are five recalls including one for lower control arm failure that impacts about 9,500 vehicles.
A fuel pump issue that affected about 1.5 million vehicles is one of the seven recalls issued for the 2019 RAV4. A Toyota dealership should repair any recall on a vehicle less than 15 years old at no charge.
2017-2018 Toyota RAV4
FIXD App Engine Reliability: 8/10
Owner-Reported Reliability: 8-9/10
KBB Value: $18,866-$20,885
Fuel Economy: 25 mpg
Annual Maintenance/Repair: $542-$546
Safety Rating: 4.4/5
The final two model years of the fourth-gen Toyota RAV4, 2017 and 2018, brought a tremendous 4-point improvement in FIXD Reliability scores. As well, owner reliability scores over this span remain elevated, gas-powered models have solid average fuel efficiency of 25 mpg, and the 32-mpg hybrid variant was available during this period.
Though the KBB value is flat from 2016 into 2017, it moves up strongly into 2018 and annual maintenance costs of about $550 for both years stay below average.
Depending on who you ask, the seats are comfortable (about 20% of owners) or uncomfortable (also about 20% of responders), which is to make the point that when shopping used RAV4s, make sure to go for a test drive and not simply rely on a friend’s experience.
One of the most common DTCs recorded during this span is P1604, which likely means the battery is low on charge. Another battery-related DTC is C1241, but this could mean it’s time for a whole new battery ($200) or a new alternator ($350). DTC P0441, an EVAP system issue, is low on the severity scale and is usually due to a loose gas cap.
There were only two recalls for both the 2017 and 2018 RAV4 with 1,000 or fewer vehicles impacted in each instance. Common to both model years was a recall for a load-carrying capacity label displaying the wrong figures.
2013-2015 Toyota RAV4
FIXD App Engine Reliability: 6-7/10
Owner-Reported Reliability: 9-10/10
KBB Value: $10,306-$13,831
Fuel Economy: 25 mpg
Annual Maintenance/Repair: $458-$571
Safety Rating: 4.2-4.4/5
2013 marks the start of fourth-generation RAV4 production, but the powertrain updates were limited to replacing the old 4-speed transmission with a new 6-speed unit. So, unlike the typical pattern of initial new generations hitting reliability hurdles, the 2013 RAV4 stepped up two points in the FIXD category and stayed near or at the top of the owner-reported reliability ratings.
A benefit of this powertrain upgrade was that average fuel economy improved from 23 mpg in 2012 to 25 mpg in 2013. As well, annual maintenance costs trend down during this period and KBB values trend up.
It’s also worth noting that while these RAV4s are around 10 years old, they average just a single day in the shop each year. Not bad. Reinforcing that reliability, up to 30% of owners feel their RAV4 will hit 200,000 miles even though they typically show only about 100,000 miles on the clock.
As is the case with many of the model years here, the EVAP system is a prime cause of CELs for the 2013 to 2015 RAV4s. DTC P0441 and P0456, the latter of which we explore in our P0456 explainer video, are both related to the system. DTC P1604, another common offender, indicates a low battery charge or the use of low-quality fuel.
Yet another feather in the reliability cap of these RAV4s is the relatively low safety recall count. There was just one for 2013 related to an accessory trailer module affecting about 1,110 vehicles. For 2014 and 2015, the same three recalls apply including one for a malfunction with the power steering. This one impacted some 110,000 vehicles.
2011-2012 Toyota RAV4
FIXD App Engine Reliability: 4/10
Owner-Reported Reliability: 8-9/10
KBB Value: $9,872-$11,047
Fuel Economy: 23 mpg
Annual Maintenance/Repair: $676-$750
Safety Rating: 3.6-4.4/5
If you’re in the market for a reliable used vehicle at a fair price, may we recommend a 2011 or 2012 Toyota RAV4? These SUVs tend to show 100,000 miles or less on the clock and market values of $10,000 to $11,000. The FIXD Reliability score moves up for 2011 and remains steady into 2012, while owner scores come in near the top of the scale.
As seen on the safety graph above, the 2011 RAV4 score does drop, but that was due to a revised testing protocol from the NHTSA that weighed on the entire industry. By 2012, Toyota had moved the safety needle back up to be better than the industry average.
Two of the most common DTCs, P1604 and P0138, shouldn’t lead to pricey repairs. The first code likely just means the battery needs charging and the second has to do with an oxygen sensor malfunction that costs about $250 to fix. If P0016 pops, this problem with the VVT system could be a bigger day at the shop as it runs between $1,000 and $1,500 to repair.
There were 11 recalls for the 2011 RAV4 including one related to a melting power window switch that impacted about 1.8 million vehicles. And of the six recalls for the 2012 model, the most significant was an issue with the seat frame cutting into the seat belt webbing that affected about one million vehicles. You can use this NHTSA VIN tool to find out if your RAV4 has any open recalls.
2009 Toyota RAV4
FIXD App Engine Reliability: 4/10
Owner-Reported Reliability: 7/10
KBB Value: $7,639
Fuel Economy: 23 mpg
Annual Maintenance/Repair:$583
Safety Rating: 4.5/5
In 2009, Toyota implemented a comprehensive overhaul to the third-gen RAV4 lineup that included swapping the 2.4L inline-4 for a more powerful 2.5L unit. While this type of work typically wreaks havoc on reliability, the FIXD Reliability score jumped three points from the prior year.
As well, the KBB value moved up and owner-reported annual maintenance bills moved down. That aligns with 12% of owners saying their RAV4 is cheap to repair. This may not sound like much, but it is one of the few times this metric registers double digits, which is not too surprising as people rarely comment on how cheap their repair bill was.
This sentiment is helped by the fact that one of the most common DTCs, an ignition coil issue indicated by C1201, costs less than $200 to fix. That being said, a new catalytic converter (DTC P0420) can run upwards of $1,500 as can a VVT solenoid issue indicated by DTC P0016.
Of the 15 recalls issued for the 2009 RAV4, one that has to do with rear tie rod corrosion and potential failure was the most significant. It impacted about 780,000 vehicles.
2002 Toyota RAV4
FIXD App Engine Reliability: 4/10
Owner-Reported Reliability: 6/10
KBB Value: $3,611
Fuel Economy: 23 mpg
Annual Maintenance/Repair: $550
Safety Rating: 4/5
The 2002 Toyota RAV4 makes our list of best model years due to impressive reliability given the age and mileage of these SUVs. Over 20 years old, the 2002 RAV4 averages 235,000 miles and yet, the FIXD Reliability score moved from 1/10 the prior year to 4/10 for 2002.
As seen on the reliability chart above, the owner-reported score moves in the other direction, but that can be explained by analyzing the survey data. There is an even split of positive and negative survey responses to the question of how reliable owners feel their RAV4 is, which pushes this subjective metric down versus the prior year.
But, the DTC count for 2002 RAV4s is near the 20-year average and when weighed with the high-mileage readings, the 2002 model is objectively reliable. So, we lean on that figure as it avoids owner perceptions and unconscious blindspots on this topic.
Additionally, this second-gen model actually posts higher fuel economy figures than the 2003 and 2005 models that received a mid-cycle refresh. Even better? There were zero recalls issued for the 2002 RAV4.
Two of the most common DTCs for this model year are related to the mass airflow (MAF) sensor. P0171, which we discuss in this explainer video, and P0174 both mean the air-to-fuel mixture ratio is out of balance. If a new sensor is required, expect to pay $300 or less.
If you see DTC P0420, which we cover in our P0420 explainer video, that bill can range from $1,500 to $2,000 as it likely means you’re due a new catalytic converter.
The Worst Years of the Toyota RAV4

Working with the same information to determine the best Toyota RAV4s, we’ve compiled the list of model years to avoid. You can expect more issues with reliability, higher maintenance bills, and in some cases lower safety ratings with these poor-performing RAV4s.
2003-2005 Toyota RAV4

FIXD App Engine Reliability: 1/10
Owner-Reported Reliability: 5-8/10
KBB Value: $4,689-$6,043
Fuel Economy: 22-23 mpg
Annual Maintenance/Repair: $500-$1,063
Safety Rating: 4-4.5/5
It’s no fun sitting atop a list of the worst Toyota RAV4s, but such is the case with the 2003 through 2005 model years. Both reliability scores, FIXD and owner-reported, hit all-time lows with the FIXD figure sitting at just 1/10 all three years.
Safety scores are good, but fuel efficiency drops in 2004 thanks to the introduction of a more potent powertrain. Other dings include the highest annual maintenance costs for any model year of over $1,000 in 2004, a market value that moves the wrong way that same year, AND annual shop visits that go as high as three days. The average is just over one.
Outward visibility is universally liked all three years; however, 50% of 2003 RAV4 owners say the seats are uncomfortable. Piling on, the 2003 and 2004 RAV4 have a 28% and 40% chance, respectively, of an expensive repair being transmission-related, far higher than the 6% average for this metric.
Given all that bad news, it’s unsurprising that the three most common DTCs across this period all hit owner wallets rather hard. DTC P0420, which means it’s time for a new catalytic converter, can lead to a bill of $2,000. P0442 and P0446 are both indicative of a charcoal canister issue within the EVAP system. Replacement runs between $750 and $1,000.
There were no recalls for the 2003 RAV4 and only two for the 2004 model, but both of them were for airbag explosion issues that affected some one million vehicles. The same airbag issues apply to the 2005 RAV4, along with three other less severe problems.
2001 Toyota RAV4
FIXD App Engine Reliability: 1/10
Owner-Reported Reliability: 9/10
KBB Value: $3,461
Fuel Economy: 23 mpg
Annual Maintenance/Repair: $250
Safety Rating: 3.5/5
Representing the first year of second-gen production, these 2001 RAV4s are best avoided. Even though the owner reliability figure is high, the FIXD Reliability score is the lowest possible value. That variance is because most 2001 RAV4 owners feel their car can easily handle a major road trip. The objective FIXD data paint a different picture.
Upkeep is low at just $250 per year on average, but so is the safety score of 3.5 out of a possible 5. As well, nearly 70% of owners think the sound system is garbage, which is by far the worst of any model year and four times higher than the average for this survey question.
These early RAV4s manage to avoid any safety recalls from the NHTSA, but the most common DTC, P0420, is a pricey one. This code indicates the need for a new catalytic converter, which will set you back between $1,500 and $2,000.
Two of the other most common DTCs, P1135 and P1155, are both oxygen sensor issues related to an imbalance in the air-to-fuel mixture ratio.
2006-2008 Toyota RAV4

FIXD App Engine Reliability: 1-2/10
Owner-Reported Reliability: 6-9/10
KBB Value: $6,114-$7,362
Fuel Economy: 22 mpg
Annual Maintenance/Repair: $821-$909
Safety Rating: 4.5/5
When the all-new third-generation Toyota RAV4 debuted in 2006, it was packing a more powerful base motor and newly optional V6. As is typical in this scenario, reliability suffered as evidenced by the FIXD scores of between one and two. The owner score also took a dive into 2006 before recovering by 2008.
It’s during this stretch that the RAV4 posts all-time low fuel efficiency figures, the KBB values don’t move much, and annual maintenance ranges between $800 and $900. Not a good combination.
To really drive the point home, the 2007 RAV4 has close to three times as many DTCs recorded by owner devices than the average across 20 years. Time in the shop each year runs up to two days and beyond, while all three model years have a high chance – up to 28% – that an expensive shop visit is engine related.
Typical trouble codes range from a roughly $150 ignition coil repair (C1201) to nearly $1,000 for a new charcoal canister (P2419) and up to $2,000 for replacing the catalytic converter (P0420).
All three of these RAV4 models also run high when it comes to annual recall notices. More than a million vehicles were impacted by a 2006 recall, one of 11 that year, for pedal entrapment. There were 14 recalls in 2007 including an airbag issue and another 14 issued in 2008 including one for tie rod corrosion that affected about 780,000 vehicles.
2010 Toyota RAV4
FIXD App Engine Reliability: 3/10
Owner-Reported Reliability: 8/10
KBB Value: $9,003
Fuel Economy: 23 mpg
Annual Maintenance/Repair: $300
Safety Rating: 4.5/5
Though 2010 was a carryover year for the RAV4, it appears the introduction of a new engine the year before delivered reliability issues a year later. It results in the FIXD Reliability score dropping to just 3/10, though annual maintenance costs are on the low side at $300.
Subjectively, owners thoroughly dislike the seats with over 40% sharing their discomfort versus the average of 15% for this metric. A similar percentage of owners were disappointed with the sound system, representing a far higher share than is typical for this survey question.
Reflecting the low annual service costs is DTC C1201, which indicates an issue with the ignition coils that can be remedied for less than $200. DTC P0455 is a similarly priced repair related to an EVAP system malfunction that could mean it’s time for a new purge valve.
The priciest DTC you’re likely to encounter in a 2010 RAV4 is P0171. This fuel pump issue could result in a $500-$600 repair. And if you own one of these 2010 RAV4s, be sure to check if the recall for a sticking gas pedal was addressed as it impacted over two million vehicles.
2016 Toyota RAV4
FIXD App Engine Reliability: 4/10
Owner-Reported Reliability: 10/10
KBB Value: $18,958
Fuel Economy: 25 mpg
Annual Maintenance/Repair: $500
Safety Rating: 4.4/5
Coinciding with the arrival of the first-generation RAV4 hybrid was a 3-point drop in the FIXD Reliability score for 2016 models. It’s a sharp enough decline to land this late model RAV4 on our list of years to avoid even though it scores a perfect 10 from owners.
That high owner-reported figure is due to 100% of survey respondents indicating their RAV4 could handle a cross-country trip without issue. However, the FIXD devices installed in owner cars show that on the whole, the 2016 RAV4 is more problem-prone than some owners think.
Market values are high and annual repair bills run below average, but the safety score in 2016 is below the industry average and 60% of owners say their RAV4 is expensive to repair. That is more than double the average for this metric.
These high bills are not helped by the fact that all three of the most common DTCs – P2401, P2402, and P2419 – indicate a new charcoal canister is needed. Part of the EVAP system, these critical components absorb fuel vapors from the gas tank and run as high as $1,000 for replacement.
There were two recalls for the 2016 RAV4 including one for a damaged o-ring within the brake assembly. This scenario causes insufficient braking pressure, an issue that impacted 16,000 vehicles.
FAQs
What years of the Toyota RAV4 have engine and/or transmission problems?
When the third-generation RAV4 arrived in 2006, it brought a newly optional V6 engine and a more powerful four-cylinder base setup. It was accompanied by reliability problems that are a main driver for the 2006, 2007, and 2008 model years landing on our list of RAV4s to avoid.
In particular, watch out for engine problems from the 2006 and 2008 models. Both years have a more than 20% chance of an expensive repair being engine-related. That correlates with both model years requiring more than $800 in annual maintenance, much higher than the $588 average.
As for transmission problems, beware of the 2004 RAV4. Not only does this model year have a 40% chance of the transmission being the cause of a $500+ repair, but it also has the dubious distinction of racking up more annual service bills than any other model year at nearly $1,100.
What is considered high mileage for a Toyota RAV4?
Though a big odometer reading is not the only factor at play when deciding what is high mileage for a vehicle, it’s a good place to start. Looking over 20 years of RAV4 data, we can see that 200,000 miles is a reasonable high water mark. Across 20 model years, only one – the 2002 RAV4 – cracks this figure with 235,000 miles on average
And only three years – the 2001, 2006, and 2007 RAV4 – come close with odometer readings ranging from 170,000 to 180,000 miles. So, 200,000 could be considered high mileage. Fortunately, 30% of owners think their RAV4 will get there versus just 2% who don’t.
What other vehicles should I consider?
As the best-selling crossover on the market, there is a lot of RAV4 competition to cross-shop including the Subaru Forester, Chevy Equinox, and Honda CR-V. Other favorites include the Kia Sportage, Ford Escape, and Nissan Rogue.
What owners of the Toyota RAV4 like to use their car for:
| Frequent Use Categories: | How Useful? (Out of 5 Stars) |
| Family Vehicle | ***** |
| Lots of Driving (travel/long commute) | **** |
| Hauling/Towing | * |
| Office on Wheels | * |
| Sport/Fast Driving | * |
| Luxurious Driving | * |
| Outdoor/Off-Road | * |
A Note About Data and Information Sources
This article has many details about Toyota RAV4 reliability; here’s what we used for our assumptions and recommendations.
- FIXD Reliability Score & Data: Engine reliability information is captured via the FIXD App.
The FIXD Reliability Score is calculated using the number of DTCs per year, weighted by mileage. This is then turned into a scale of 1-10 for easy graphing.
This is an objective score.
- Owner Reliability Score & Data: This data is the result of surveying Toyota RAV4 owners who use FIXD.
The Owner Reliability Score comes straight from owners of the Toyota RAV4.
This is a subjective score.
To determine the Owner Reliability Score we ask each car owner:
How reliable would you say your Toyota RAV4 is?
a. Just point A to point B driving
b. A Daily Commuter
c. Good for a 100-mile road trip
d. Good for a 500-mile road trip
e. I could take a cross-country road trip, no problem
From here we translate their answers into the Owner Reliability Score:
a. = 2
b. = 4
c. = 6
d. = 8
e. = 10
Keep in mind, owners may think their car is more or less reliable than it actually is.
One potential problem is that people often buy the same make or model they are used to when they go car shopping, just a newer year.
Ford, for instance, has a number of consumer loyalty awards for the Ford F-Series, Ford Mustang, and Ford Expedition.
Car owners may be so loyal to the make or model they currently own that they would have trouble accurately comparing their cars’ reliability to others.
It’s for this reason that we ask car owners a question that is relative to mileage rather than relative to other cars.
Still, be mindful of the accuracy of these Owner Reliability Scores, people’s perceptions and unconscious blindspots can skew data.
We suggest looking at both the FIXD Reliability Score and the Owner Reliability Score for this reason.
- KBB Value: Average private-seller valuations as supplied by Kelley Blue Book (KBB), based on a Toyota RAV4 with typical mileage for that respective model year.
- Fuel Economy: Mileage-per-gallon estimates according to the EPA MPG on Fueleconomy.gov
- Annual Maintenance/Repair: Upkeep expenses as reported by surveyed Toyota RAV4 owners
- Safety Rating: Crash test data collected and reported by NHTSA. We average all ratings for each year to come up with a simplified, average safety score. This makes it easier to look at on a graph.
References
- Toyota RAV4 model-specific information. Retrieved May 31, 2023, from https://www.edmunds.com/
- Toyota RAV4 model-specific recall information. Retrieved May 31, 2023, from https://www.nhtsa.gov/recalls
- Toyota RAV4 model-specific information. Retrieved May 31, 2023, from https://www.auto-brochures.com
- Toyota RAV4 model-specific information. Retrieved May 31, 2023, from https://pressroom.toyota.com/

Niel Stender grew up doing replacement work on his old Cherokee and sweet Mitsubishi Starion, which led to a degree in mechanical engineering and a job at Ford as a vehicle dynamics engineer. His writing infuses that automotive background with sales and marketing experience. Writing about cars for close to a decade now, he enjoys digging into some of the more technical mechanical systems under the hood and throughout a vehicle.