Toyota Sienna Engine Reliability Score, Safety Ratings, MPG and Value v.s. Maintenance & Repair Costs – Year by Year
As you shop for a Sienna minivan, you want to use this information to make a better decision. With these four charts, we help you look at the bigger picture, giving you the engine reliability, average repair costs, fuel economy, resale values, and safety scores.
If you’re in the market for a car, take a look at our article on the USAs’ most reliable and cheapest to repair cars in the U.S. Don’t get stuck with a lemon, use our data to help you shop.
Engine Reliability Score – Over The Years
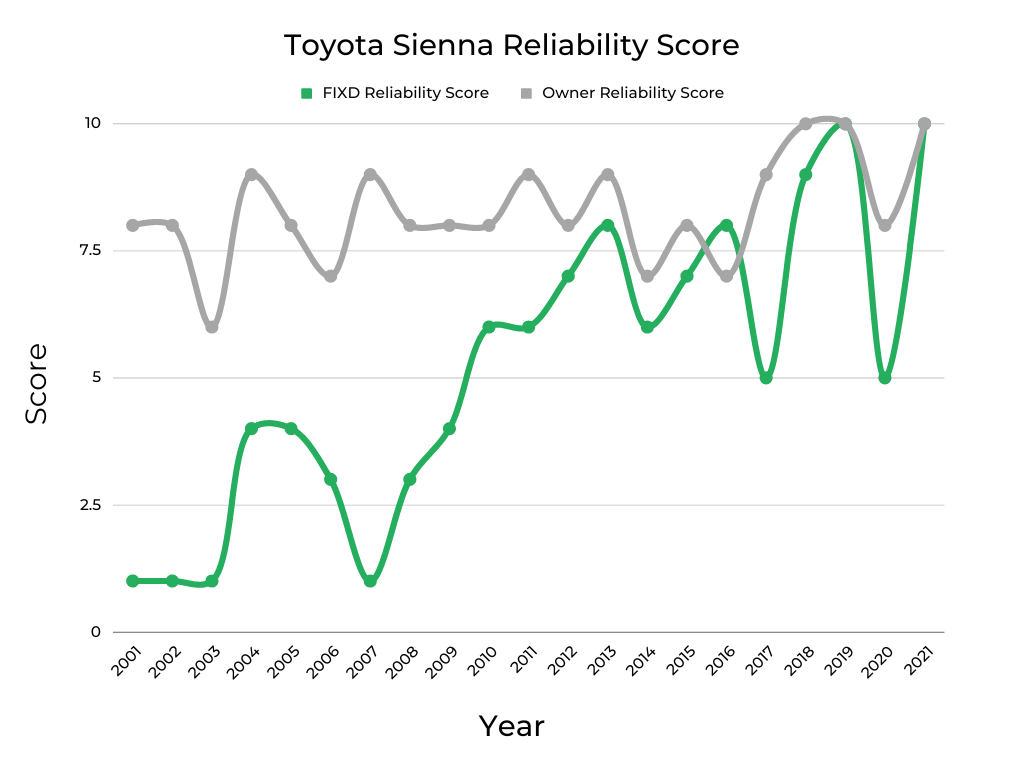
This chart reveals the reliability of Toyota Sienna models based on two factors.
- The FIXD Reliability score (Green line) – data is sourced based on how many check engine lights are thrown by Toyota Sienna models during every 12,000 miles of driving (1 year’s worth of driving).
- The Owner Reliability score (Gray line) from surveyed Toyota Sienna owners.
The charts range from 1 to 10, with 1 being the lowest score and 10 being the highest. A score of 5 is considered average engine reliability.
With the two lines, you see similar movements. When there’s a larger gap between the two lines, it could be that owners are being overly generous with the rating, or the FIXD data doesn’t represent a large enough selection to provide a more accurate determination. For this reason, we look at the whole picture with the other data mentioned to ensure you better understand which models excel and which ones don’t.
As with most vehicles, the newer the Sienna is, the more reliable it tends to be. While this statement has some exceptions, the fewer miles the van has on the odometer, the less you may have to worry about reliability.
Before you shop for a used minivan, reference these Toyota Sienna reliability scores to determine what model years you should look at. If you already have a Sienna model in mind, go ahead and jump to the detailed section about that particular year range to learn more.
Also, take a look at our Toyota CEL article if you want to know more about the check engine lights for each of the Toyota models.
NHTSA Safety Score – Over The Years
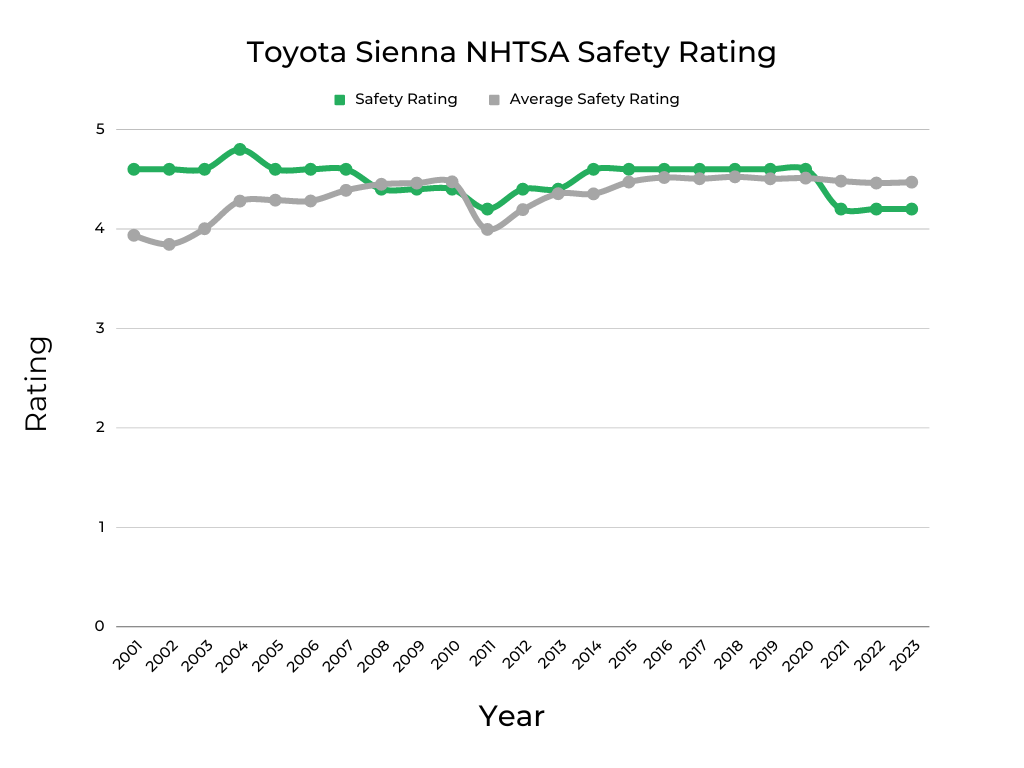
The National Highway Transportation Safety Administration (NHTSA) is responsible for performing crash tests on most vehicles, and it determines an average safety score for every model year. We put this data into a handy chart, so you can compare how each model performs.
The average safety rating for every Sienna model is revealed as a Green line. It’s running parallel with the gray line that shows the average rating across the board on all of the vehicles we rank with NHTSA data. As you compare the two lines, you see which Sienna models perform the best in relation to all other vehicles.
This chart shows that the 2008-2010 and 2021-2023 Toyota Sienna dropped below the national average. However, the ratings themselves are still considered fairly good and don’t cause much alarm.
If you drive a minivan with higher safety ratings, getting cheap car insurance for your used vehicle is easier.
If you live in one of the states listed below, we can show you the cheapest vehicles to insure in yours.
| What Used Cars Are the Cheapest To Insure In: |
| Ohio |
| North Carolina |
| Michigan |
| Georgia |
| Texas |
| New York |
| Illinois |
| Pennsylvania |
| California |
MPG – Over The Years
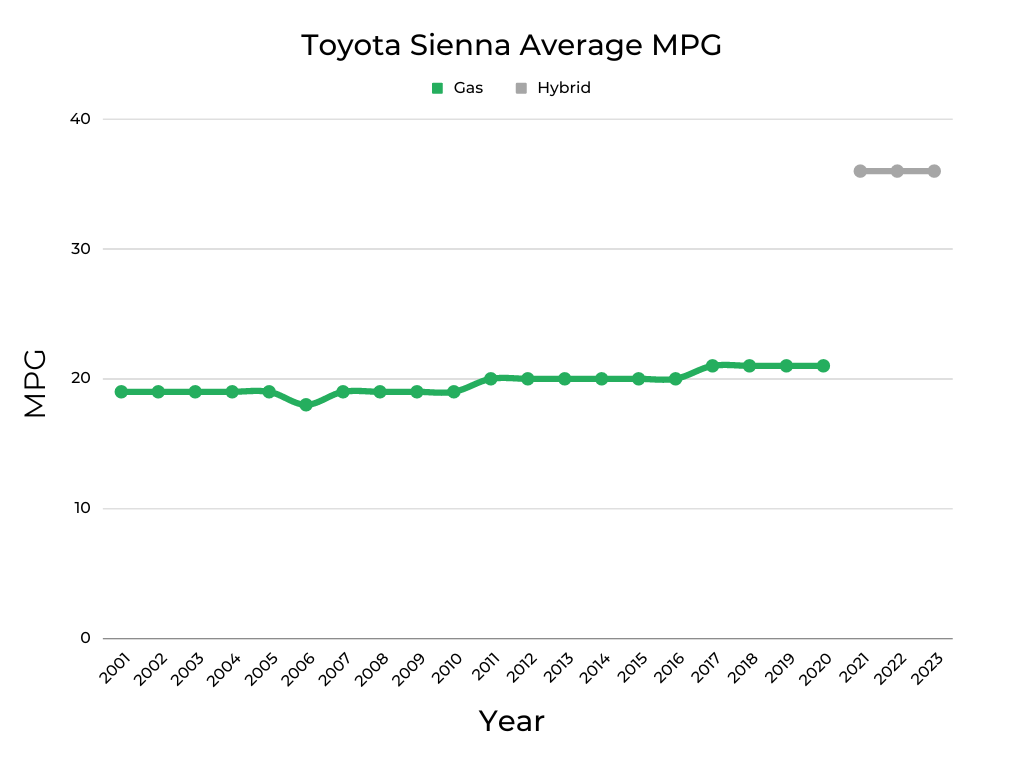
Whether you are handling the carpool for a week or you are dropping the kids off at soccer practice, you want to know that your gas money stretches as far as possible. With our graph, you can see the average Sienna fuel economy by model year, determining which ones are going to help you hold onto your money better. This graph illustrates the average mpg per year based on the information provided by fueleconomy.gov. The green line indicates the average mpg for gas models, while the gray line shows the average mpg for hybrid models.
Obviously, you get a lot more bang for your buck by choosing a newer hybrid. 36 mpg is a lot better than even the best gas-powered models at 21 mpg. That extra 15 mpg is going to add up to a lot of savings.
Current Market Value of All Toyota Sienna Years & Cost Per Year to Repair and Maintain Each
It may not always be easy figuring out an appropriate budget for a vehicle, but you can learn a lot by looking at what other owners of similar models spend. By taking into account the vehicle reliability, you get a better view of the whole picture. It’s also important to think about how much time the minivan may be down for each repair, leaving you without a vehicle.
Repair costs also affect resale values, which is important if you ever want to sell the Toyota Sienna. A newer minivan without a lot of problems will sell for more than one that’s older and riddled with mechanical defects. Yet, you don’t want to assume that a newer model is going to cost less to maintain, especially if one turns out to be a lemon.
We advise you to look at all of the model years carefully. If you find two that have similar resale values, you may do better to choose the newer one. As long as the reliability is rated highly, you can receive more equipment and features for the cost.
For our estimated values, we look at the model year compared with the average mileage reported by our survey respondents. Mileage is a crucial factor in determining the KBB value, which is why you should run your own resale value report before buying any used vehicle.
If you’d like to learn about this vehicle’s past depreciation rate & our projected depreciation rate based on that, check out: Toyota Sienna | Depreciation Rate & Curve Graphed.
When shopping for a used Toyota Sienna, it’s important to keep in mind that not all vehicles are cared for equally. To protect yourself from lemons, take along a FIXD Sensor on your test drive. FIXD connects to a free app on your smartphone to tell you more about the vehicle you’re checking out, including check engine lights and other hidden issues that the owner or dealership may be attempting to hide. Click here to learn more and get FIXD for only $19.99 (regular price $59)!
Important Features Timeline

The Best Years of the Toyota Sienna

Combining all of this data, it’s much easier to see which Sienna model years are worth investing in. While we rely heavily on the FIXD Reliability score to pick our favorites, we also balance this data with the Owner Reliability score, fuel economy, safety ratings, and other factors. By adding in the open recalls provided by the National Highway Traffic Safety Administration (NHTSA), and the most common diagnostic trouble codes (DTCs), you can get the full picture.
2020-2021 Toyota Sienna

FIXD Reliability Score: 5-10/10
Owner Reliability Score: 8-10/10
KBB Value: $26,780-$39,009
Fuel Economy: 21 mpg (gas), 36 mpg (hybrid)
Annual Maintenance/Repair: $375-$536
Safety Rating: 4.2-4.6/5
The 2020 Toyota Sienna makes up the last model of the 3rd generation, while the 2021 is the first model after a complete redesign. Yet both have decent reliability scores and a low cost of ownership.
The FIXD Reliability score on the 2020 Toyota Sienna is a 5 out of 10, while the 2021 Sienna earns a perfect 10 out of 10. Additionally, the Owners Reliability score hits a perfect 10 out of 10 with the 2021 Sienna and an 8 out of 10 on the 2020 model.
The NHTSA crash testing score for the 2021 Toyota Sienna is 4.2 (out of 5). The 2020 model does a little better, with a rating of 4.6 (out of 5).
Both minivans have a low cost of ownership, with the 2021 costing the least of the two. Additionally, neither model is suffering from higher-than-average repair bills. These models may also be covered under the existing 3-year/36,000-mile limited warranty or 5-year/60,000-mile powertrain warranty, further reducing repair costs.
The most prevalent codes with the 2020 Toyota Sienna include System Too Lean – Bank 2 (P0174) and System Too Lean – Bank 1 (P0171). With both of these problems, you may need to replace the Mass Air Flow Sensor, costing between $172 and $309. The 2021 Toyota Sienna also shows a higher chance of the Evaporative Emission Control System Incorrect Purge Flow (P0441) code. If the warranty covers these problems, you may not have to pay anything out of pocket for the repairs.
The 2020 Toyota Sienna only has two open recalls. In comparison, the 2021 Toyota Sienna shows one.
2017-2019 Toyota Sienna
FIXD Reliability Score: 5-10/10
Owner Reliability Score: 9-10/10
KBB Value: $19,642-$23,117
Fuel Economy: 21 mpg
Annual Maintenance/Repair: $500-$750
Safety Rating: 4.6/5
These three Sienna models also receive favorable reliability scores and have a decent cost of ownership, although there is a slightly elevated risk of more expensive repairs.
The FIXD Reliability score on the 2017 Toyota Sienna is a 5 out of 10, while the 2018 Sienna earns a 9 out of 10, and the 2019 model gets a perfect 10 out of 10. Additionally, the Owners Reliability shows a perfect 10 out of 10 on both the 2019 and 2018 Sienna and a 9 out of 10 on the 2017 model.
The NHTSA crash testing score for all three Sienna models is 4.6 (out of 5). Not only is this very close to perfect, but it’s also above the average for all vehicles we’ve tracked.
Considering these minivans are now more than a couple of years old, the cost of maintenance and repair isn’t excessive. The lowest of the three is the 2017 at an estimated $500 per year. From there, the 2018 model is rated at $688, and the 2019 Sienna averages $750 per year. The biggest concern of the three models is an elevated chance of costly engine repairs on the 2019 minivan.
All three Sienna models deal with the System Too Lean – Bank 2 (P0174) code. This may require a new Mass Air Flow Sensor, costing between $172 and $309. We also see the Performance Decline of Brake Function (C1441) code with the 2017 Toyota Sienna. The most common repair has been a new brake booster, costing $465 to $616.
There are nine recalls for the 2017 Toyota Sienna and seven for the 2018 Toyota Sienna. There are also seven open recalls on the 2019 Toyota Sienna.
2015-2016 Toyota Sienna
FIXD Reliability Score: 7-8/10
Owner Reliability Score: 7-8/10
KBB Value: $13,374-$16,061
Fuel Economy: 20 mpg
Annual Maintenance/Repair: $350-$640
Safety Rating: 4.6/5
The reliability scores remain consistent across these two Toyota Sienna models and the cost of ownership is fairly low.
The FIXD Reliability score on the 2015 Toyota Sienna is 7 out of 10, while the 2016 Sienna earns 8 out of 10. The results are flip-flopped with the Owners Reliability scores, revealing 8 out of 10 on the 2015 model and 7 out of 10 with the 2016 lineup.
The NHTSA crash testing score for both Sienna models is 4.6 (out of 5). This rating continues to remain above average, proving to be a safe choice for busy families.
The cost of repair and maintenance is also surprisingly low. On the 2015 Sienna, the average is just $614. Yet, that goes down even lower (to $350) with the 2016 Toyota Sienna. However, both minivans have a higher chance of expensive brake repairs.
One of the most prevalent codes on both Sienna models is the Startability Malfunction (P1604) DTC. In many cases, this turns out to be a minor issue, sometimes only requiring a new fuel filter or car battery replacement.
The 2015 Toyota Sienna has six open recalls. However, the 2016 Toyota Sienna has fewer, with only four currently showing.
2012-2014 Toyota Sienna

FIXD Reliability Score: 6-8/10
Owner Reliability Score: 7-9/10
KBB Value: $7,826-$12,432
Fuel Economy: 20 mpg
Annual Maintenance/Repair: $393-$596
Safety Rating: 4.4-4.6/5
Rounding out our top choices are the 2012 to 2014 Siennas. These minivans continue to have reliable scores and decent ownership costs.
The FIXD Reliability score is highest on the 2013 Toyota Sienna at 8 out of 10. The 2012 Sienna earns a 7 out of 10, and the 2014 Sienna gets a 6 out of 10. Similarly, the Owners Reliability Score is highest, with the 2013 model at 9 out of 10, while the 2012 model earns an 8 out of 10, and the 2014 Sienna gets a 7 out of 10.
The NHTSA crash testing score remains at 4.6 (out of 5) for the 2014 Toyota Sienna. However, it drops slightly to 4.4 (out of 5) on the 2012 and 2013 models.
The lowest cost of ownership for the three is with the 2014 Toyota Sienna, rated at $393 per year. Both the 2013 and 2012 models have an average cost of $596 per year. However, all three models continue to show higher instances of expensive brake repairs.
These three Toyota minivans also show more instances of the Startability Malfunction (P1604) DTC. As discussed with other models, this could be a minor problem, such as a fuel filter or car battery. We also see the O2 Sensor Circuit Voltage Low – Bank 2, Sensor 2 (P0157) code with the 2012 minivans. If the fix requires an oxygen sensor, you could spend $153 to $306, on average.
The 2012 Toyota Sienna shows nine recalls and one investigation. While the 2013 Toyota Sienna only has six recalls, there’s still an investigation worth noting. Additionally, the 2014 Toyota Sienna reveals the same, with six recalls and one investigation.
The Worst Years of the Toyota Sienna
2006-2007 Toyota Sienna

FIXD Reliability Score: 1-3/10
Owner Reliability Score: 7-9/10
KBB Value: $3,826-$5,003
Fuel Economy: 18-19 mpg
Annual Maintenance/Repair: $1,063-$1,143
Safety Rating: 4.6/5
Among the worst models are the 2006 and 2007 Toyota Sienna. Not only do these models have an increased chance of expensive engine repairs, but the cost of annual maintenance and repair is off the charts.
The FIXD Reliability score of the 2006 Toyota Sienna is 3 out of 10, while the 2007 Sienna earns the lowest score possible, a 1 out of 10. The Owners Reliability Score is 7 out of 10 with the 2006 minivan and 9 out of 10 with the 2007 Sienna. These ratings are probably higher due to customer loyalty because the data suggests that these models aren’t that great.
The NHTSA crash testing score continues to be at 4.6 (out of 5) for both models. This rating continues to prove that the minivan was built to protect families.
The biggest issue among these two models is the cost of ownership. On average, the 2006 model may cost $1,143 per year, while the 2007 is rated at $1,063. Both models suffer from an exceptionally high chance of expensive engine or fuel system repairs, which can be a problem considering the lower resale values.
2006 Toyota Sienna minivans suffer from the Catalyst System Efficiency Below Threshold – Bank 1 (P0420) trouble code and Catalyst System Efficiency Below Threshold – Bank 2 (P0430) code. These repairs may require a new catalytic converter, costing an average of $1,538 to $2,041. The most prevalent codes with the 2007 Toyota Sienna include System Too Lean – Bank 2 (P0174) and System Too Lean – Bank 1 (P0171). With both of these problems, you may need to replace the fuel pump, costing between $457 and $617.
The NHTSA data on the 2006 Toyota Sienna is alarming. This model has 11 recalls and three investigations, but the 2007 Toyota Sienna does better with ten recalls and zero investigations.
2010-2011 Toyota Sienna
FIXD Reliability Score: 6/10
Owner Reliability Score: 8-9/10
KBB Value: $5,563-$6,336
Fuel Economy: 19-20 mpg
Annual Maintenance/Repair: $750-$1,050
Safety Rating: 4.2-4.4/5
The 2010 and 2011 Toyota Siennas have below-average safety scores. They also tend to cost more to repair, mainly because of the higher chance of brake problems.
The FIXD Reliability score of the 2010 and 2011 Toyota Sienna is 6 out of 10. The Owners Reliability Score is 8 out of 10 on the 2010 Sienna and 9 out of 10 on the 2011 model.
The NHTSA crash testing score is 4.4 (out of 5) on the 2010 Toyota Sienna. It goes down to 4.2 (out of 5) with the 2011 model.
The biggest complaint with these two models is the cost of ownership. The 2010 model may cost $750 per year on average, but the 2011 Sienna is rated at $1,050. Both models suffer from an exceptionally high chance of expensive brake repairs, and the 2011 model shows a higher instance of transmission trouble.
2010 Toyota Sienna models suffer from the Random, Multiple Misfire Detected (P0300) trouble code. To replace an ignition coil and possibly fix this problem, you may spend $51 to $173. The 2011 Toyota Sienna also tends to suffer from the Camshaft Position (A) Actuator Circuit Bank 2 (P0020) code. If this repair requires a Variable Camshaft Timing (VCT) Solenoid, you could spend $1,016 to $1,531.
The 2010 Toyota Sienna has eight recalls, according to the NHTSA. However, the 2011 Toyota Sienna shows 14 recalls and an investigation.
2001-2005 Toyota Sienna
FIXD Reliability Score: 1-4/10
Owner Reliability Score: 6-9/10
KBB Value: $2,377-$3,464
Fuel Economy: 19 mpg
Annual Maintenance/Repair: $417-$917
Safety Rating: 4.6-4.8/5
The 2001 through 2005 Sienna models have several things against them but aren’t as bad as some other. They sit closer to the mid-range of the lineup, but the increased chance of expensive repairs can make these models a no-go because of the lower resale value.
The FIXD Reliability score of the 2001-2003 Toyota Siennas is 1 out of 10. 2004 and 2005 models earn a 4 out of 10. In comparison, the Owners Reliability Score is 6 out of 10 on the 2003 Sienna, 8 out of 10 on the 2001, 2002, and 2005 models, plus 9 out of 10 on the 2004 Toyota Sienna.
The NHTSA crash testing score is 4.8 (out of 5) on the 2004 Toyota Sienna. All four other models received a rating of 4.6 (out of 5).
When it comes to the average cost of repairs and maintenance, there’s a vast range between the five models. The lowest is the 2004 Sienna at $417 a year, while the highest is the 2002 at $917. However, all five have a higher chance of particular failures that lead to more expensive bills. For the 2002-2004 Siennas, you have to worry about engine repairs, while the 2001 and 2005 struggle with brake problems and a higher chance of AC/heat repair.
2001, 2002, 2004, and 2005 Toyota Siennas suffer from the Catalyst System Efficiency Below Threshold – Bank 1 (P0420) trouble code and Catalyst System Efficiency Below Threshold – Bank 2 (P0430) code. These repairs may require a new catalytic converter, costing an average of $1,538 to $2,041. Additionally, the 2003 model shows a higher chance of the HO2S Heater Control Circuit Low – Bank 1 Sensor 1 (P0031) code.
The 2001 Toyota Sienna has two recalls, while the 2002 Toyota Sienna only has one but also includes an investigation into the mix. The 2003 Toyota Sienna also has one recall, but the 2004 Toyota Sienna has ten recalls and a whopping ten investigations. On top of that, the 2005 Toyota Sienna has 12 recalls and six investigations.
2008-2009 Toyota Sienna
FIXD Reliability Score: 3-4/10
Owner Reliability Score: 8/10
KBB Value: $5,021-$6,001
Fuel Economy: 19-20 mpg
Annual Maintenance/Repair: $750-$778
Safety Rating: 4.4/5
Sitting about average among all of the Sienna models are the 2008 and 2009 years. Reliability scores are about average and the cost to maintain is also in the middle.
The FIXD Reliability score of the 2008 Toyota Sienna is 3 out of 10, while the 2009 Sienna earns 4 out of 10. In comparison, the Owners Reliability Score is 8 out of 10 with both models.
The NHTSA crash testing score is 4.4 (out of 5) with both Sienna minivans. While this is lower than many of the newer models, it’s nothing to be alarmed about.
The two models have a relative annual maintenance and repair cost. The 2009 model is lower at $750, but the 2008 only goes up slightly at $778. Yet, both models have an increased occurrence of engine, brake, AC/heat, and fuel system repairs costing more than $500.
The 2009 Toyota Sienna deals with the Catalyst System Efficiency Below Threshold – Bank 1 (P0420) trouble code, along with Catalyst System Efficiency Below Threshold – Bank 2 (P0430) code. These repairs may require a new catalytic converter, costing $1,538 to $2,041, on average. However, it could also need an oxygen sensor, costing between $153 and $306. Both the 2008 and 2009 Sienna also struggle with the Cylinder 2 Misfire Detected (P0302) DTC. We show the most probable fix is an ignition coil, costing $51 to $173.
The 2008 Toyota Sienna suffers from nine recalls. In comparison, the 2009 Toyota Sienna shows ten recalls.
FAQs
What years of the Toyota Sienna have engine and/or transmission problems?
The Toyota Sienna models with a higher chance of expensive engine repairs include the 2002-2004, 2006-2009, and 2019. There’s also a higher instance of transmission repairs with the 2004, 2008, 2011, and 2014-2015 minivans.
What is considered high mileage for a Toyota Sienna?
Most people use their minivans for dropping kids off at school and running errands, so they aren’t put under a lot of stress. However, the biggest factor in determining how long the Sienna will last is to look at how well it was maintained. It’s possible to push a Sienna over the 200,000-mile mark if it’s well cared for.
Based on our data, a high-mileage Toyota Sienna could be considered anything over 150,000 miles.
Older Toyota Sienna models (2001-2010) show an average mileage range between 135,000 and 205,000. The 2005 has the highest mileage in our surveys, but there are plenty that get close to 200,000 miles. Just keep in mind that the Sienna’s resale value decreases with higher mileage. If you encounter an expensive mechanical problem on a high-mileage Sienna, it may no longer be worth fixing.
Do any hybrid years have problems?
The hybrid Sienna models are newer, as they were just released with the 2021 model year. For this reason, there’s not a lot of data to pull from yet. However, our initial reports suggest that the hybrid powertrain is reliable and free of any major defects.
What other vehicles should I consider?
Minivans have been largely replaced by SUVs on the roads. For that reason, Toyota doesn’t make another minivan you could choose from. Yet, there are some Toyota SUVs with three rows that may make a good replacement. You can select the 4Runner, Highlander, or Sequoia. If you prefer a hybrid powertrain, consider the Highlander Hybrid instead.
If you would rather stick with a minivan, we suggest looking at the Honda Odyssey or Chrysler Pacifica. You may also prefer the Kia Carnival. For used models, you can also look at the Dodge Grand Caravan, Nissan Quest, or Kia Sedona.
What owners of the Toyota Sienna like to use their car for:
Percent based x/5-star: 0-10% = 1, 11-20% = 2, 21-30% = 3, 31-40% = 4, 41%+ = 5
| Frequent Use Categories: | How Useful? (Out of 5 Stars) |
| Family Vehicle | ***** |
| Lots of Driving (travel/long commute) | *** |
| Hauling/Towing | * |
| Office on Wheels | * |
| Sport/Fast Driving | * |
| Luxurious Driving | * |
| Outdoor/Off-Road | * |
A Note About Data and Information Sources
This article has many details about Toyota Sienna reliability; here’s what we used for our assumptions and recommendations.
- FIXD Reliability Score & Data: Engine reliability information is captured via the FIXD App.
The FIXD Reliability Score is calculated using the number of DTCs per year, weighted by mileage. This is then turned into a scale of 1-10 for easy graphing.
This is an objective score.
- Owner Reliability Score & Data: This data is the result of surveying Toyota Sienna owners who use FIXD.
The Owner Reliability Score comes straight from owners of the Toyota Sienna.
This is a subjective score.
To determine the Owner Reliability Score we ask each car owner:
How reliable would you say your Toyota Sienna is?
a. Just point A to point B driving
b. A Daily Commuter
c. Good for a 100 mile road trip
d. Good for a 500 mile road trip
e. I could take a cross-country road trip, no problem
From here we translate their answers into the Owner Reliability Score:
a. = 2
b. = 4
c. = 6
d. = 8
e. = 10
Keep in mind, owners may think their car is more or less reliable than it actually is.
One potential problem is that people often buy the same make or model they are used to when they go car shopping, just a newer year.
Ford, for instance, has a number of consumer loyalty awards for the Ford F-Series, Ford Mustang, and Ford Expedition.
Car owners may be so loyal to the make or model they currently own that they would have trouble accurately comparing their cars’ reliability to others.
It’s for this reason that we ask car owners a question that is relative to mileage rather than relative to other cars.
Still, be mindful of the accuracy of these Owner Reliability Scores, people’s perceptions and unconscious blindspots can skew data.
We suggest looking at both the FIXD Reliability Score and the Owner Reliability Score for this reason.
- KBB Value: Average private-seller valuations as supplied by Kelley Blue Book (KBB), based on a Toyota Sienna with typical mileage for that respective model year.
- Fuel Economy: Mileage-per-gallon estimates according to the EPA MPG on Fueleconomy.gov
- Annual Maintenance/Repair: Upkeep expenses as reported by surveyed Toyota Sienna owners
- Safety Rating: Crash test data collected and reported by NHTSA. We average all ratings for each year to come up with a simplified, average safety score. This makes it easier to look at on a graph.
References
- Toyota Sienna, wikipedia.org. Retrieved June 2, 2023, from https://en.wikipedia.org/wiki/Toyota_Sienna
- Toyota Sienna review, edmunds.com. Retrieved June 2, 2023, from https://www.edmunds.com/toyota/sienna/
- Toyota Manuals & Warranties, toyota.com. Retrieved June 4, 2023, from https://www.toyota.com/owners/resources/warranty-owners-manuals

Brian Jones owns a used car dealership outside of Dallas, Texas. He has also worked for decades as an ASE Certified Master Technician for a variety of new car dealerships. Now he spends his time consulting dealerships and writing for some renowned publications, such as Motor1 (https://www.motor1.com/info/team/brian-jones/). When he’s not working, he’s tinkering around with pickup trucks and traveling with his family.